Mk I K-Coronameter Instrument
Instrument Description
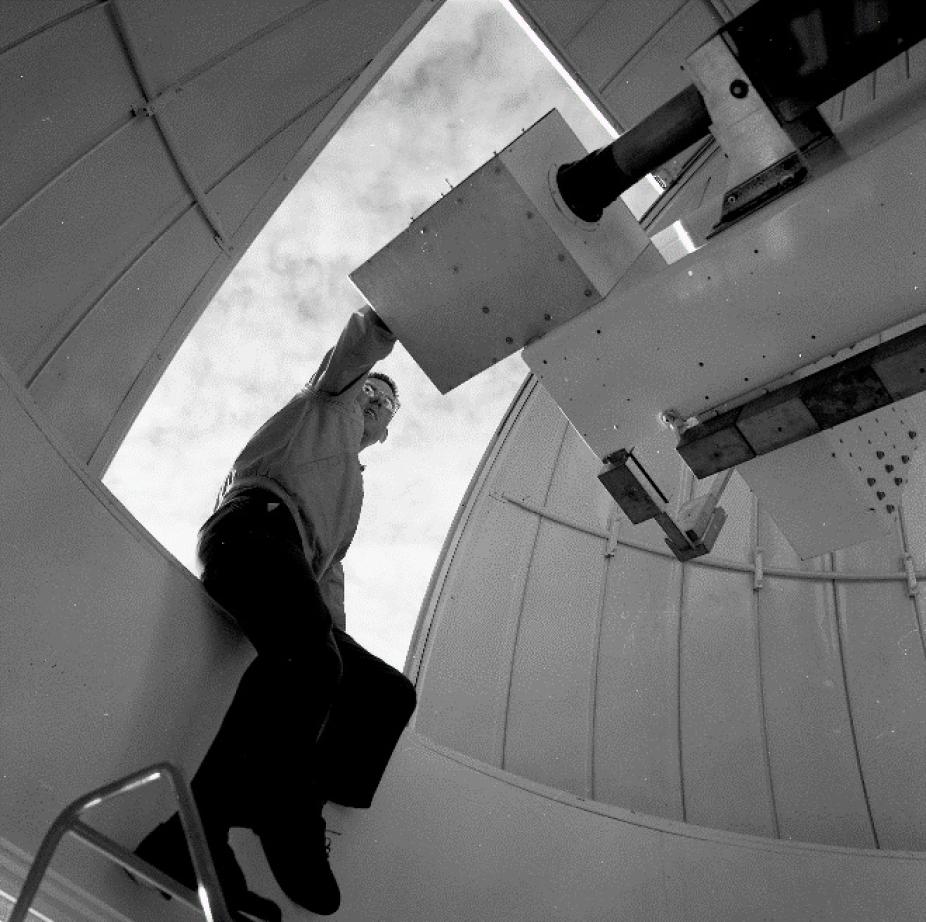
Figure 1. Scientist Dick Hansen works on the K-Coronameter at MLSO in 1967.
The first K-coronameter (later known as Mk I) was an internally occulted white light coronameter to record the polarization brightness (pB) of the Thomson scattered K-Corona continuum emission. The instrument is shown on the spar at the Mauna Loa Solar Observatory (MLSO) in Hawaii in Figure 1. A mechanical layout of the K-Coronameter is shown in Figure 2. The brightness of the polarized light was measured with a sensitive photoelectric polarimeter using electro-optic modulation of the light beam and a half-wave plate made of two quartz plates whose optical axes were crossed and had thicknesses that differed by half a wavelength for l = 500 nm. These rotated at half the speed of a 360 degree scan around the corona (i.e. 8 minutes). Following the aperture stop the beam was modulated using a quarter-wave plate that included a ‘Z-cut’ crystal of ammonium dihydrogen phosphate (ADP) and a polaroid. The retardation of the beam was proportional to the voltage applied to the crystal. The voltage frequency, and the modulation of the light, was 50 Hz. A cone with a small hole drilled along its axis isolated the region of the corona for scanning around the Sun. A complete coronal scan took 4 minutes. Measurements were acquired every 5 degrees around the Sun. The half-angle of the cone could be varied to scan the corona at different heights from 1.125 out to 2 solar radii (as measured from Sun center). An example of the region isolated by the cone is shown in Figure 3. A full description of the instrument is provided in Wlerick and Axtell(1957), Newkirk 1958, and Lee and Fullerton 1961.
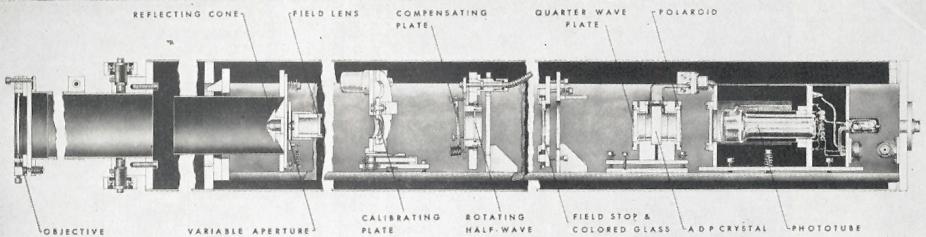
Figure 2. Schematic Drawing of the High Altitude Observatory Mk I K-Coronameter.
Instrument Details
- 8 cm aperture
- Internally ‘occulted’
- Central wavelength: 520.0 nm (see Newkirk, Curtis and Watson IGY report 1958)
- Bandpass: 140 nm
- Spatial Sampling: 39 arcsec per ‘pixel’
- Spatial Resolution = 78 arcseconds
- Field-of-View: 1.125 to 2 solar radii
- Focal length: 193 cm
- Background Noise level ~10-08 B/Bsun
- Instrument polarization < 10-03
Available Data
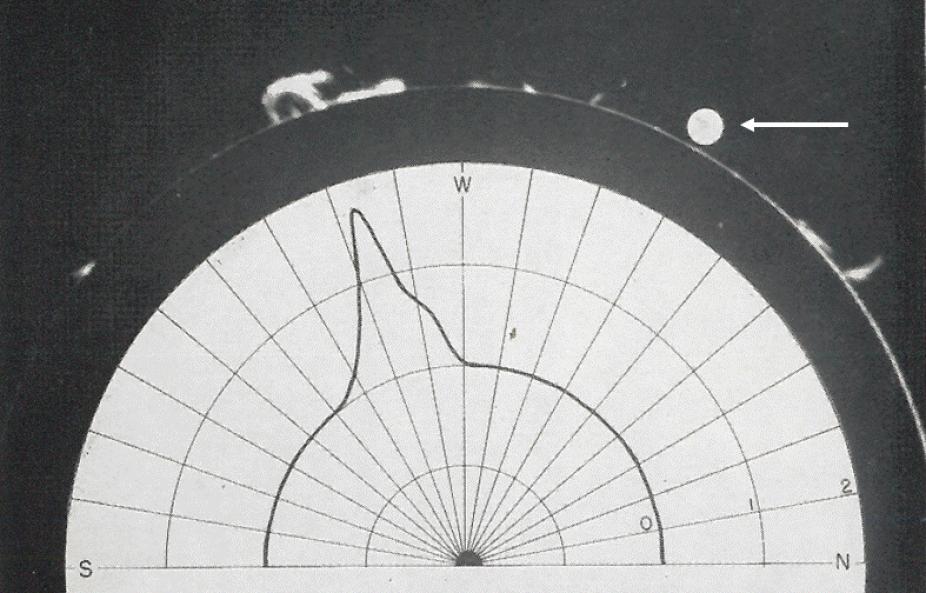
Figure 3. A sample Mk I K-Coronameter scan taken on August 9, 1957 superposed on a limb image taken in the Helium D3 line (587.6 nm). The arrow points to a white circle that indicates the size of the scanning aperture.
The K-Coronameter took daily scans of pB intensity at up to 3 heights in the corona (see figure 3). It did not take images of the corona. Daily scans at 1.5 solar radii are available as digitized synoptic maps in fits and gif format covering the later mission from June 1965 until September 1978. Hard copy daily scans early in the mission (September 1956 through November 1960) are available in pdf format.
Science Goals
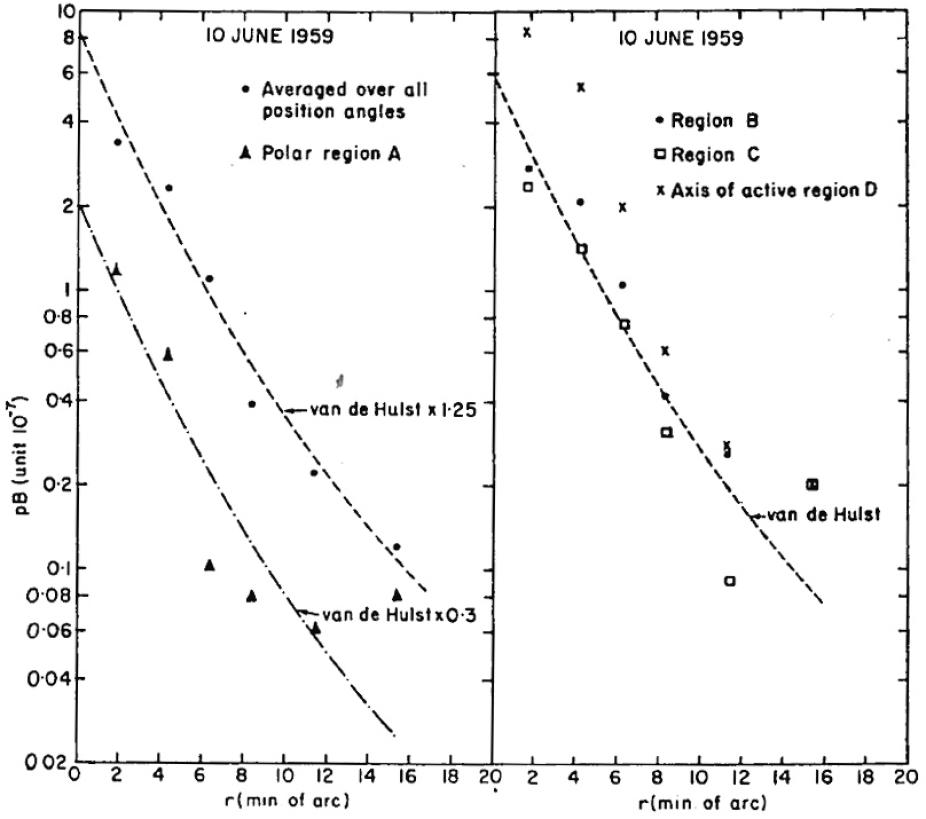
Figure 4. K-Corona pB intensity falloff with distance from the Sun as observed by the Mk I K-Coronameter in June 1959. K-coronameter data are indicated by the dot and triangle data points. Plots are from Newkirk et al. 1959, Nature. See Newkirk 1959 paper for more information. The K-Coronameter was able to observe the K-Corona to heights as great as 2 solar radii [16 arcmin] above the solar limb.
The primary scientific goal for the K-Coronameter was to observe the brightness of the white light continuum corona, and derive the coronal electron density, out to greater heights above the solar limb than could be viewed using coronal emission lines (see Figure 4). Coronal emission line brightness falls off much more rapidly than white light continuum emission which limited emission line observations to about 1.3 solar radii. Furthermore, it had been recognized that the spatial distribution of the white light corona often differed from the emission corona. It was hoped that simultaneous measurements of the white light and emission line corona could lead to a better understanding of the structure of helmet streamers and determine the cause of recurrent magnetic storms at Earth.
Calibration Information
Calibration of the Mk I K-Coronameter is discussed in detail in a 1958 IGY report by Newkirk, Curtis and Watson. Calibration discussion includes the correction for the sky signal, primary and secondary scattering, correction techniques and polarization angle. A second report to the IGY Solar Activity Series in 1962 by Heynekamp contains a further discussion of K-Coronameter data reduction and data accuracy and uncertainties. A further correction to the absolute photometric calibration of the K-Coronameter is noted by Fisher and Sime (1984) based on the calibration of HAO standard opals by Elmore, Streete and Eddy 1970. Links to papers are available in reference section below.
Observing Sites
The first operational testing of the HAO Mk I K-Coronameter was performed in March 1956 at the Sommers-Bausch Observatory of the University of Colorado in Boulder. It was mounted on the 26-foot equatorial spar at Climax Observatory in Colorado (see Figure 5) and began continuous day-to-day operation in September 1956. There were periods where the instrument and/or spar were down for upgrades or repairs. Down periods early in the mission occurred during these intervals: Dec. 1958 to May 1959; Oct. 1960 to Sept. 1961; May 1962 to Sept 1962. Due to degrading coronal skies at the Climax site, the Mk I K-coronameter was moved to the new Mees facility on Haleakala on Maui Hawaii and first observations were acquired in September 1962. Due to rapid development at Haleakala and flying insects at the site, the K-Coronameter was moved again to a 10-ft. equatorial spar at the new Mauna Loa Solar Observatory on the island of Hawaii in early December 1965 and began acquiring data on December 10, 1965. Mk I was eventually replaced by the Mk III K-Coronameter which began operation in January 1980.
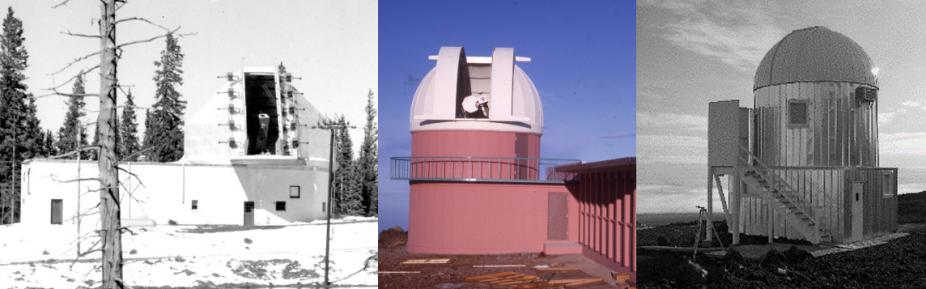
Figure 5. The three observing sites that housed the HAO Mk I K-Coronameter. Left: The K-Coronameter operated at the Climax Observatory in Colorado from 1956 to 1962; Center: In 1962 the K-Coronameter was moved to the newly built Mees Observatory on Haleakala on Maui, Hawaii; Right: In 1965 the K-Coronameter was moved to the newly built MLSO on the island of Hawaii.
References for Mk I
Elmore, D.F., J.L. Streete, J.A. Eddy, 1970, Calibration of Opal Glass Attenuators, High Altitude Observatory, National Center for Atmospheric Research Astro-Geophysical Memorandum No. 178
Fisher, R. and D.G. Sime, 1984, Solar Activity Cycle Variation of the K Corona, Astrophys. J., 285, pp 354-358
Heynekamp, Chr. E., 1962, Observations of the Solar Electron Corona Part II, January 1958 to November 1960, IGY World Data Center A, Solar Activity Report Series, #16, July 4, 1962
Lee, Robert H., and John G. Fullerton, 1961, K-Coronameter Observed the Sun’s Electron Corona, Electronics, Nov. 24, 1961, McGraw Hill Publishing
Newkirk, Gordon, Jr., 1958, Emission-Line Polarization in Prominences, Pub. Astron. Soc. Of the Pacific, 70, 413, pp 185-190
Newkirk, G., Jr., G.W. Curtis and K. Watson, 1958, Observations of the Solar Electron Corona September 1956 to January 1958, IGY World Data Center A, Solar Activity Report Series, #4, 15, August 1958
Newkirk, G.A., G.W. Curtis, D.K. Watson, R. Manning, J. Shelby, 1959, The Inner Solar Corona during June 1959, Nature, 184, pp. 1308-1309
Wlérick, Gérard and James Axtell, 1957, A New Instrument for Observing the Electron Corona, Astrophys. J., 126, pp. 253-258