For the first time a mesoscale-resolving whole atmosphere general circulation model has been developed. This was accomplished using the National Center for Atmospheric Research Whole Atmosphere Community Climate Model with ∼0.25° horizontal resolution and 0.1 scale height vertical resolution above the middle stratosphere (higher resolution below). This is made possible by the high accuracy and high scalability of the spectral element dynamical core from the High-Order Method Modeling Environment. For the simulated January–February period, the latitude-height structure and the magnitudes of the temperature variance compare well with those deduced from the Sounding of the Atmosphere using Broadband Emission Radiometry (SABER) observations.
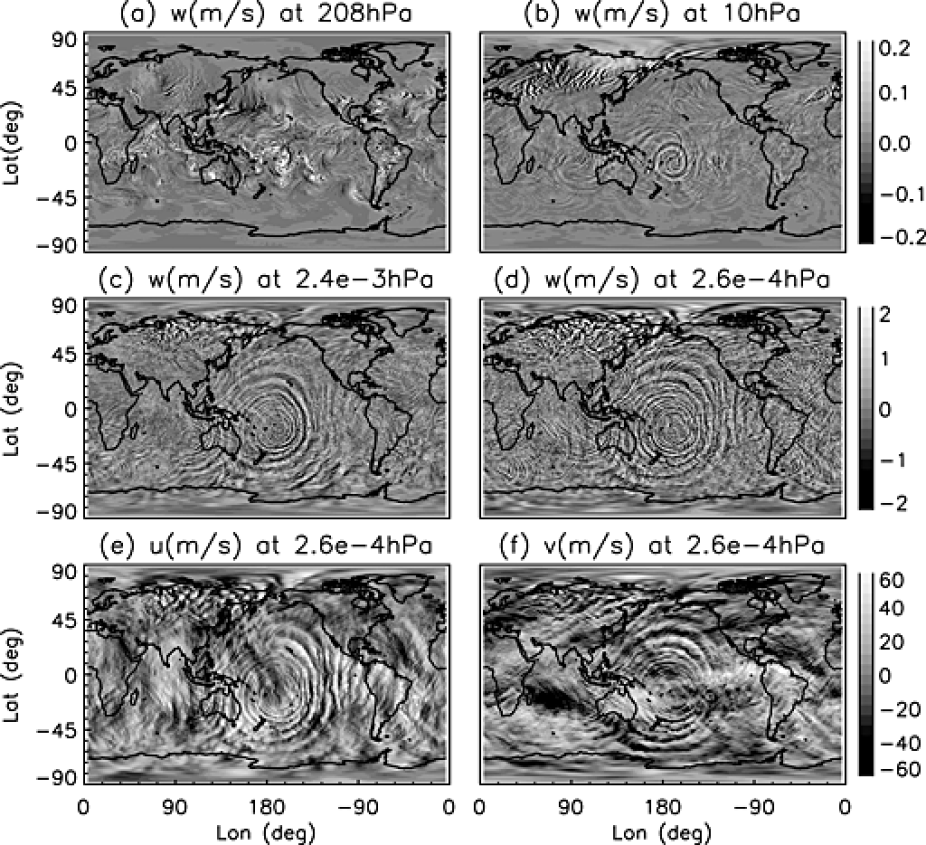
WACCM simulation results for 4 February at 21:00 UT. (a–d) Vertical winds at 208 hPa (∼11 km), 10 hPa (∼30 km), 2.4 ×10⁻³h Pa (∼87 km), and 2.6 ×10⁻⁴ hPa (∼100 km), respectively. (e-f) Zonal and meridional winds at 2.6 ×10⁻⁴ hPa. The contour range is smaller than the actual range of the winds to better visualize the wave structures. In Figure 1a the maximum upward wind over the TC is 4 m s−1; in Figures 1b–1d the maximum values of the vertical winds are 0.6 m s−1, 9 m s−1, and 7.5 m s−1, respectively; in Figures 1e and 1f the maximum values of the horizontal winds are 162 m s−1 and 114 m s−1.
The simulation reveals the increasing dominance of gravity waves (GWs) at higher altitudes through both the height dependence of the kinetic energy spectra, which display a steeper slope (∼−3) in the stratosphere and an increasingly shallower slope above, and the increasing spatial extent of GWs (including a planetary-scale extent of a concentric GW excited by a tropical cyclone) at higher altitudes. GW impacts on the large-scale flow are evaluated in terms of zonal mean zonal wind and tides: with no GW drag parameterized in the simulations, forcing by resolved GWs does reverse the summer mesospheric wind, albeit at an altitude higher than climatology, and only slows down the winter mesospheric wind without closing it. The hemispheric structures and magnitudes of diurnal and semidiurnal migrating tides compare favorably with observations.
Also see:
GRL paper: Gravity waves simulated by high-resolution Whole Atmosphere Community Climate Model
Wired article: Science Graphic of the Week: Mesmerizing Animation Shows the Turbulent Weather at the Edge of Space