The Corona Through the Solar Cycle
Not surprisingly, the changes in the surface magnetic field distribution through the solar cycle, as evidenced by the evolving numbers and spatial distributions of sunspots, prominences and filaments (slide 17 and slide 18), are also reflected in the corona.
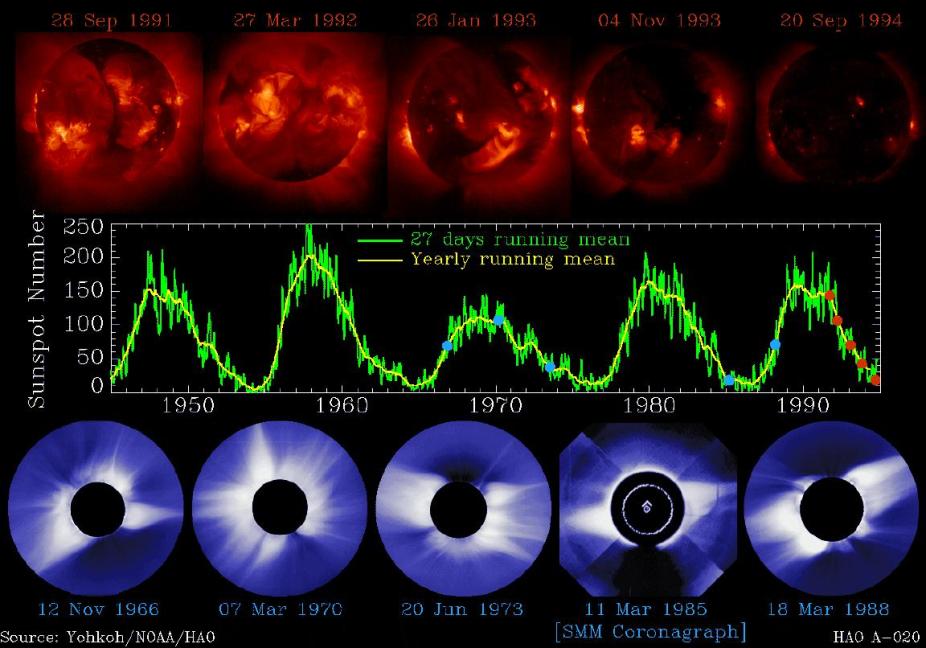
Soft X-ray images from the Yohkoh satellite.
The top row of images are X-ray images from the Yohkoh satellite, spaced approximately 10 months apart during the descending part of cycle 22. The overall decrease in X-ray luminosity for the solar disk as a whole is in many ways as spectacular as the decrease in the number of active regions seen at a given time on the disk. The bottom row shows a few eclipse photographs spanning the time period 1966–1988, together with a coronal image constructed from Solar Maximum Mission data for 1985, essentially at solar minimum. Note how the corona is reduced to a belt of streamers symmetrically straddling the solar equator. The 1980 eclipse of slide 9 occurred at the very peak of solar cycle 21; contrast the appearance of the white light corona then, with streamers appearing at all latitudes, with the solar minimum corona.
Written By P. Charbonneau and O.R. White–April 18, 1995