The Sunspot Cycle
The number of sunspots visible on the solar disk vary continuously at any given time, as sunspots are carried on and off the visible disk by solar rotation. True variations occur following the appearance of new sunspots and sunspot groups via magnetic flux emergence (slide 16), as well as fragmentation and disappearance of existing spots and groups.
Sunspots visible on the solar disk vary continuously at any given time.
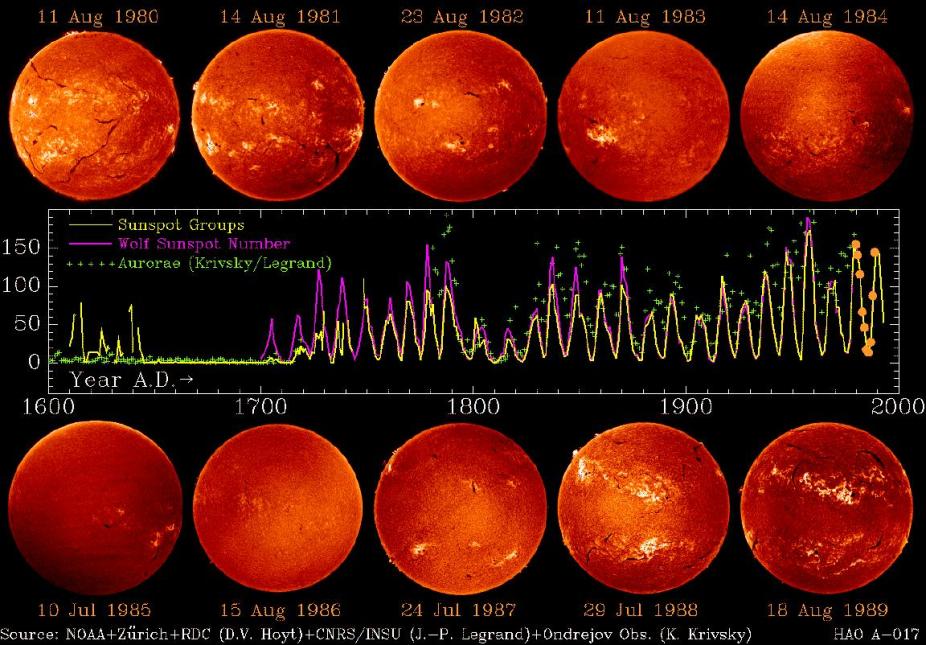
At first glance, observations carried out over time periods of weeks/months suggest that the latter two phenomena are stochastic in nature, but observations over time periods of decades reveal an intriguing cyclic pattern of gradual increase and decrease in the average number of sunspots visible on the solar disk. This was first noted in 1843 by H. Schwabe, an amateur solar astronomer, and provided the first hint of the existence of the sunspot cycle, whose period Schwabe estimated to be about 10 years. Further work revealed that the length of successive sunspot cycles is not strictly constant but varies from ~ 9 to 11.5 years, with an average cycle period of about 10.8 years. The plot shown on this slide is a historical reconstruction of yearly-averaged sunspot group counts (yellow curve), extending all the way back to the first telescopic sunspot observations in the early seventeenth century. The purple curve is the Zürich normalized sunspot number. Note how the amplitude of the cycle, or the peak average number of sunspots seen in a given year, varies from one cycle to the next. Note also how cycles are asymmetric, in that the rise from sunspot minimum to maximum occurs more rapidly than the subsequent fall from sunspot maximum to minimum. Another striking feature on this plot is the dramatically reduced number of sunspots observed in the time period spanning the years 1645 - 1715. This was first noticed by G. Spörer, and investigated more systematically by E.W. Maunder. This time period is now usually referred to as the Maunder minimum. Proxies of geomagnetic activity such as aurorae (green crosses) correlate well with the sunspot number, in the sense that lower auroral counts are associated with low amplitude sunspot cycles (e.g., 1940 - 1960), and high counts with high amplitude cycles (1800 - 1822). The Maunder minimum shows up particularly well in the auroral record.
The rise and fall of sunspot numbers are only one manifestation of the solar cycle. Solar astronomers traditionally label solar cycles from one minimum to the next, and assign them numbers starting at one with the 1755 - 1766 cycle. At this writing (January 1995) we are in the descending phase of cycle 22. Remembering that sunspots are associated with magnetic fields, it is tempting to assume that the sunspot cycle is primarily magnetic in origin. This hypothesis is corroborated by turning to other tracers of the solar magnetic field. The sequence of Hα images shown on the slide are spaced one year apart, covering the descending phase of cycle 21 and rising phase of cycle 22. Sunspot minimum occurred in 1985 - 1986. The quality of individual images varies, and no attempt has been made to calibrate the overall intensities; The changes in active region coverage (i.e., bright regions in Hα), and in the number and distribution of filaments and prominences, are nevertheless striking. Filaments and Hα bright regions gradually vanish from 1980 to 1986, and reappear again in 1987. Note how active regions gradually "drift" toward the equator through the descending part of the cycle, and are then first observed at 30 - 40 degrees latitude once the next cycle begins. Observations in white light confirm that sunspots follow the same pattern, a phenomenon first studied in detail and reported in 1858 by another amateur solar astronomer, R.C. Carrington.
Written By P. Charbonneau and O.R. White–April 18, 1995