Coronal and Heliospheric Evolution
The magnetic field in the Sun's atmosphere continuously evolves through processes of emergence, diffusion, and reconnection, resulting in ongoing reorganizations of the global coronal/heliospheric magnetic morphology, as well as in the slow buildup of magnetic energy in twisted or sheared magnetic fields.
HAO scientists undertake observational and theoretical studies of the build-up of magnetic energy and other slow (month-to-year timescale) changes in coronal and heliospheric magnetic fields. Currently, HAO scientists are conducting observational studies and forward modeling of coronal prominences and cavities to better understand the precursor magnetic structure and triggers of coronal mass ejections.
GLOBAL CORONAL MAGNETIC MORPHOLOGY
HAO archive of solar eclipse images.
The evolution of global magnetic fields, in particular the distribution of structures that are magnetically closed vs. magnetically open to the solar wind, is clearly seen in coronal morphology. Historically, changes in the coronal magnetic morphology have been witnessed via solar eclipses. HAO has built an archive of images of solar eclipses which are deemed to be of sufficient quality for research. The data begin from 1869, extend to the present day and are from a diverse range of sources, but have been converted to a standard format. The data up to 1969 were all compiled by Jack Eddy between 1969 and 1971. Original plates were painstakingly photographed by Eddy and associates at HAO onto plates currently archived at HAO (Judge et al., 2010).
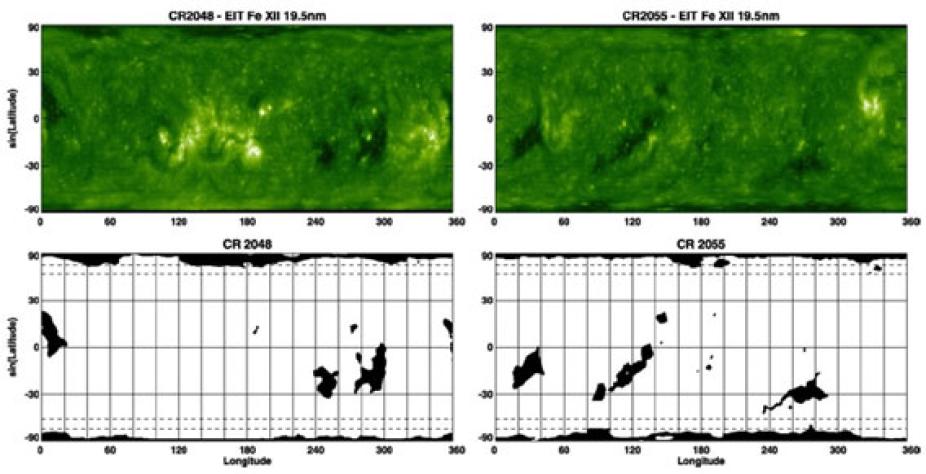
Figure 1: EUV synoptic maps in the Fe XII 19.5 nm line for CR 2048 (September–October 2006) and CR 2055 (April 2007) near the minimum between Cycles 23 and 24 (top)and corresponding coronal hole maps (bottom). The mean sunspot number for the two Carrington Rotations was 10.1 and 2.1, respectively. The maps are in sin(latitude) and the dashed lines in the coronal hole maps correspond to 60° and 50° latitude. De Toma (2011).
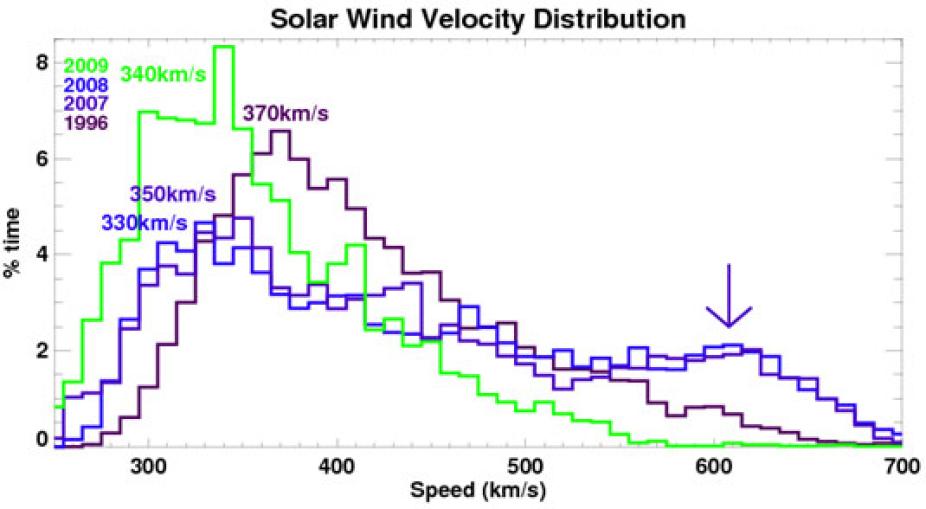
Figure 2: Distribution of solar wind speed at the Earth for 1996 (in purple), 2007 and 2008 (in blue), and 2009 (in green). The mean speeds for these years are: 423km/s, 440km/s, 449km/s and 364km/s, respectively. While the yearly averaged solar wind speed in 2007 and 2008 are comparable to the one in 1996, the velocity distribution is quite different. In 2007 and 2008 the distribution is almost a bimodal distribution with a primary peak at slightly lower velocities than in 1996 and a secondary peak near 600km/s. This high velocity tail is due to recurrent, high-speed streams originating in the large, low-latitude coronal holes present at the Sun during these years. In 2009, with the close down of the large low-latitude coronal holes, velocities drop dramatically and speeds above 600km/s become almost completely absent in the solar wind reaching the Earth.
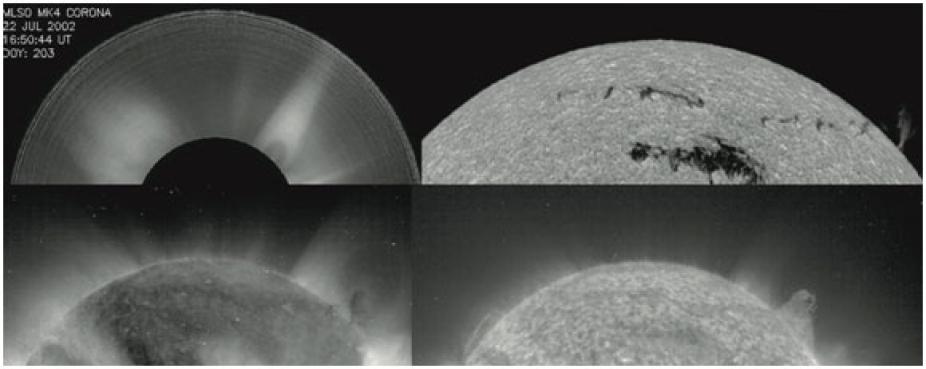
Figure 3: July 22, 2002 observations of a polar crown filament and associated cavity. Clockwise from top left: HAO MLSO Mk4 white-light coronagraph; Big Bear Solar Observatory H-alpha; SOHO/EIT 284 Angstroms; SOHO/EIT 304 Angstroms.Gibson et al. (2006) .
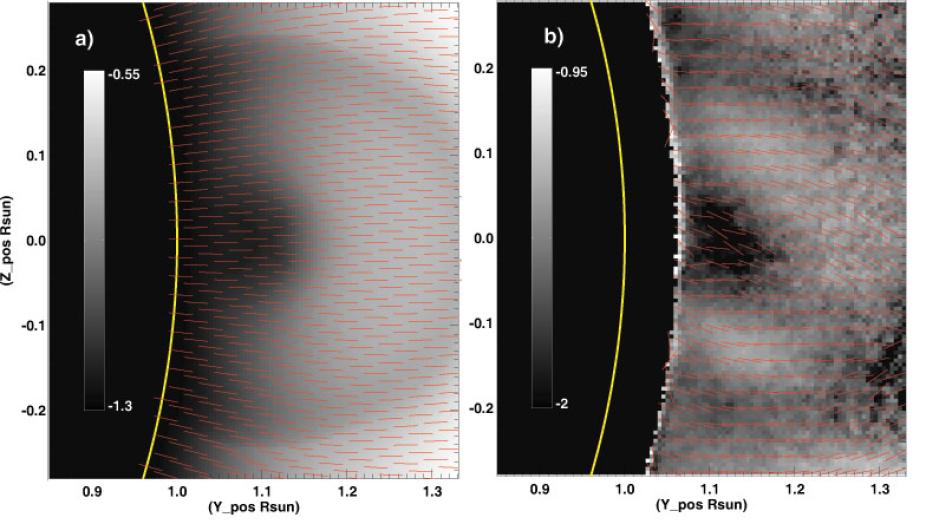
Figure 4: Line-of-sight-integrated Stokes linear polarization P/I for (a) forward-calculated spheromak configuration and (b) Coronal Multi-Channel Polarimeter (CoMP) observations of April 21, 2005 southwest cavity. The range indicated by the color bar for (a) corresponds to 5–28% linear polarization, and for (b) corresponds to 1–11% linear polarization. Red lines indicate direction of P/I vectors. See Dove et al. (2011).
Ongoing evolution of the current coronal magnetic morphology can be seen in daily observations from the Mauna Loa Solar Observatory white light coronagraph, which illustrates the shape and structure of the closed magnetic field. It can also be seen in observations of coronal holes, which represent regions of open coronal magnetic field. They are called coronal holes because they have relatively low electron density and temperature so they appear dark in X-ray and EUV. Coronal holes are not easy to identify in observations because they are not the only dark regions in the corona and bright structures in the optically thin coronal lines can partially obscure their boundaries. In recent years, the availability of observations at multiple wavelengths has made their detection easier, making it possible to follow changes in coronal hole area and location and provide observables to validate against coronal models (Figure 1).
Coronal holes are the source of fast solar wind, and low-latitude coronal holes can result in fast solar wind streams that impact the Earth. When such coronal holes are long-lived, fast wind speeds recur with periods associated with the Sun's ~27 day rotation and contribute significantly to the overall solar wind intersecting the Earth (Figure 2). Such recurring high-speed streams can result in associated periodic signals in the Earth's geospace environment (Gibson et al., 2009; Emery et al, 2011).
CORONAL PROMINENCE CAVITIES
Coronal mass ejections (CMEs) are driven by magnetic energy. In some cases, for example CMEs associated with active regions, rapid flux emergence may drive eruptions over relatively short time periods (e.g., days). However, in other cases the buildup of magnetic energy is slow, occurring over weeks if not months. Polar crown filaments (PCFs) (Figure 3) illustrate such gradual storage of magnetic energy, and may erupt multiple times over the course of their lifetime (months if not years). Dark coronal cavities are fundamental components of CMEs, and are also often seen surrounding PCFs, indicating that they are key components of these magnetohydrodynamic equilibrium states. Their plasma properties as observed in their quiescent phase provide clues to the nature of such equilibria and how they may ultimately be lost during CMEs.
Coronal cavities have long been observed in white light, both during eclipses and in coronagraph data (Read more »). The 2008–2010 International Space Science Institute (ISSI) International Team on Prominence Cavities successfully undertook a broad observational analysis of prominence cavities in multiple wavelengths (from radio to soft Xray to white light), and compared these to physical models (Read more »). This work established for the first time measurements of large-scale line-of-sight flows in cavities, a three-dimensional model of cavity morphology, density and temperature properties of cavities in the low corona, and evidence for twisted magnetic flux rope fields within a cavity (Figure 4), Fuller and Gibson (2009), Schmit et al. (2009), Gibson et al. (2010), Schmit and Gibson (2011), Dove et al. (2011).