Long-Term Solar Variability
HAO scientists pursue an interdisciplinary, system-wide view on the origins and impacts of solar and stellar cycle variation, with a particular focus on magnetic minima as times of low activity and relatively simple heliospheric structure.
The solar activity cycle, as manifested by repeated increase and then decrease in the number of sunspots visible on the Sun, has been observed and analyzed for centuries. However, only for the past two to three ~11-year activity cycles have new capabilities in satellite and ground-based observations allowed us to consider how a broad range of solar, heliospheric, and geospace observables vary within and between cycles. These observations, in conjunction with theoretical and numerical modeling advances, enable an interdisciplinary, system-wide view on the origins and impacts of solar cycle variation.
SOLAR CYCLE OBSERVATIONS
While sunspots were first observed by Chinese astronomers in 800 B.C., systematic observations of sunspots through the telescope started around 1600. In 1843, a German astronomer, Samuel Schawbe, first discovered that the number of sunspots wax and wane in a cyclic fashion with an 11-year periodicity. This is called the sunspot cycle or the solar cycle, which is also compactly characterized by a butterfly diagram (Courtesy: G. de Toma). This diagram represents a latitude-time plot of the positions of all observed sunspots. Such a latitude-time diagram is generally derived from the longitude-averaged magnetograms of the National Solar Observatory.
The principal features of solar cycles seen here are:
- Appearance of sunspots in a latitude belt within ~±35° latitude
- Equatorward migration of this belt with an ~11 year periodicity
- Poleward migration of the large-scale radial fields with an ~11 year periodicity
- A certain phase relationship between the sunspots and surface radial fields, such that the polar reversal takes place approximately during the epoch of sunspot maxima, and polar field surges to maximum strength occur during sunspot minima
- The sign of the magnetic field in each hemisphere for a given cycle is by convention defined to be the follower spots in that hemisphere. With this sign convention, the polar field is seen to change sign from positive (white) to negative (black) when the sunspot cycle (sign of the follower spots) has already been negative
- The northern and southern hemispheres of the sun are magnetically coupled by antisymmetric magnetic fields about the equator. We see in the butterfly diagram (Figure 1) that in a particular cycle, all the follower spots in the bipolar spot groups are positive (white) in one hemisphere and negative (dark) in the other hemisphere. In the next and preceding cycles, all the polarities are reversed. In each cycle, the dark features are poleward in one hemisphere, the white features poleward in the other hemisphere. These patterns also reverse with each succeeding cycle.
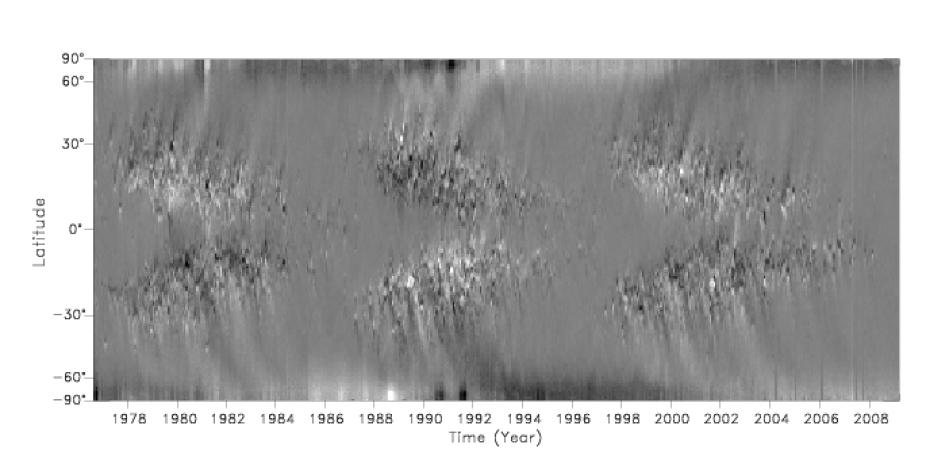
Figure 1: NSO magnetogram Butterfly diagram.
AN UNUSUAL MINIMUM
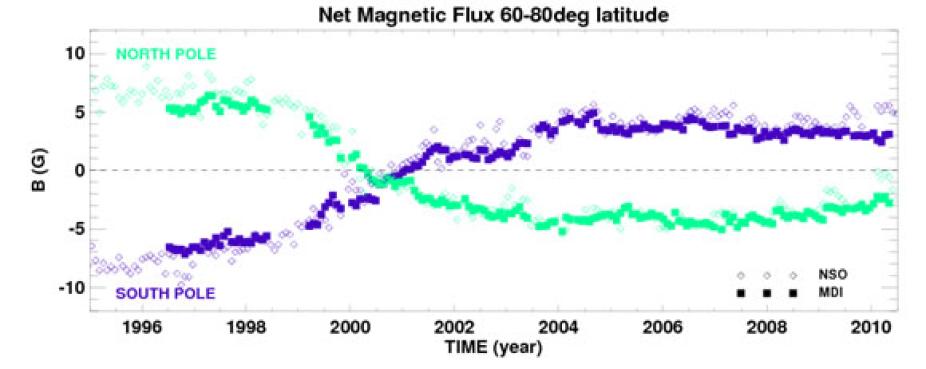
Figure 2: Net polar magnetic flux as measured at the Sun's photosphere between 60° and 80° latitude by SOHO/MDI (squares) and at NSO (diamonds) from 1995 to 2010. The polar magnetic flux has been at about the same level since 2004 and is significantly lower than during the previous minimum in 1996. See De Toma (2011).
Solar minimum represents the time of lowest solar activity and simplest heliospheric structure, and as such is a good place to begin putting together a system-wide understanding. However, recent observations imply complexities in the variation within and between solar minima that have implications for analyzing and predicting space weather responses at the Earth during solar quiet intervals, and also for interpreting the Sun's past behavior as preserved in cosmogenic isotopes and historical sunspot and aurorae records. For example, the last solar cycle minimum was very quiet, with the sunspot number dropping to its lowest values in at least 75 years. Additionally, the polar magnetic fields were about 40% weaker than during the previous minimum (Figure 2).
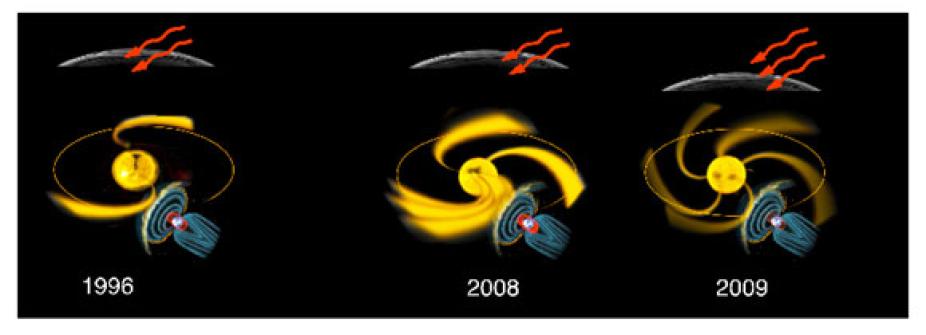
Figure 3: Artist's conception of the sun-heliosphere-Earth system for the last two solar minimum. Compared are solar wind morphology (faster wind streams indicated in yellow emanating from coronal holes), impact for the Earth's radiation belt (large relativistic electron population indicated by red), and cosmic rays (high levels indicated by number of squiggly red arrows). See Gibson et al. (2009) and Gibson et al. (2011).
However, despite this global "weakness", the Sun continued to send out strong solar wind gusts during low-activity months that acted as periodic drivers of the Earth's space environment and upper atmosphere, sustaining the population of relativistic electrons in the Earth's outer radiation belt even in 2008 when sunspots had reached record lows (Figure 3).
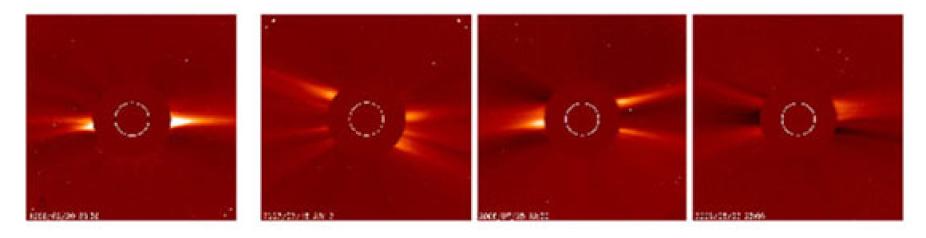
Figure 4: White-light images of the solar corona from LASCO/C2 for the previous solar minimum on February 20, 1996 (left panel), and the recent minimum (last three panels) on February 15, 2007, July 25, 2008, and May 22, 2009. All images correspond to very quiet times: the observed sunspot number for the four days was 8, 0, 8, and 0, respectively. During the 1996 minimum, the shape of the corona was dipolar and coronal streamers were confined to a narrow region around the heliographic equator while in 2007, 2008, and 2009 coronal streamers extended to relatively high heliolatitudes. See De Toma et al. (2010).
This was in contrast to the past cycle, in which the radiation belts faded away before solar minimum, and was a direct consequence of a more complex magnetic configuration at the Sun. In particular, the coronal magnetic field this cycle did not simplify to a dipole and the heliospheric current sheet remained substantially warped (Figure 4) even after sunspots and TSI decreased dramatically. It is possible that these seemingly discrepant observations are jointly consequences of the weakened polar magnetic field. In any event, it is clear that the sunspot number does not tell the whole story about how the interaction between the solar wind and the Earth's geospace environment may be substantially altered during times of low solar activity.
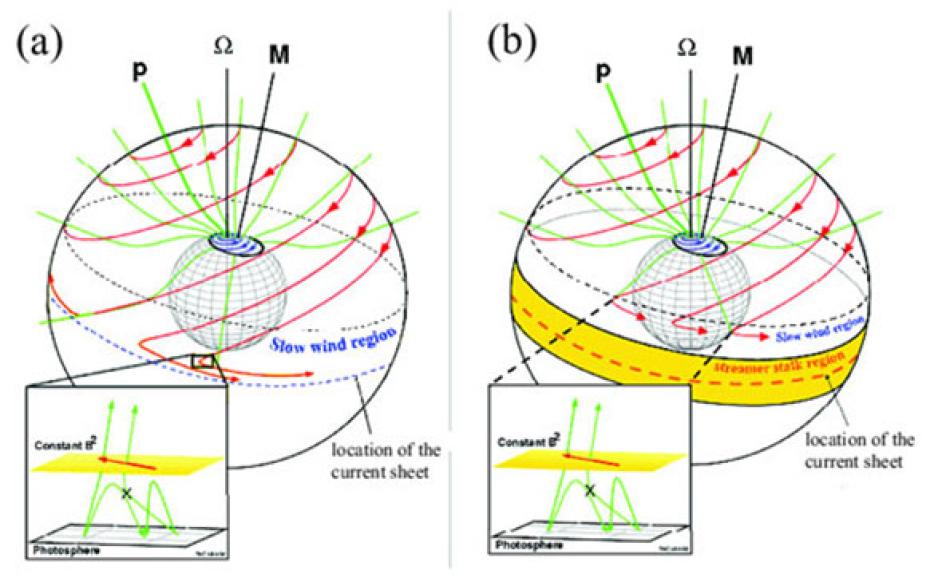
Figure 5: (a) An illustration of the motions of the magnetic field on the Sun in the frame corotating with the equatorial rotation rate (Fisk, 1996, 2005; Fisk, Zurbuchen, and Schwadron, 1999b; Fisk and Schwadron 2001). The M-axis is the axis of symmetry for the expansion of the magnetic field from a polar coronal hole. The Ω-axis is the solar rotation axis. P marks one of the open lines (green) that connects to the Pole. The curves with arrows (red) are the trajectories of the open lines. (b)The open lines reconnect and diffuse outside the streamer-stalk region, which is marked in yellow. See Zhao and Fisk (2010).
Analyses of solar-wind composition data also indicate differences between the most recent solar minimum and prior ones, although without necessarily requiring revision of concepts relating the solar wind and interplanetary magnetic field. These studies demonstrate that there are two distinct regions of solar wind: solar wind likely to originate from the stalk of the streamer belt (the highly elongated loops that underlie the heliospheric current sheet), and solar wind from outside this region (Figure 5). The region outside the streamer-stalk region is noticeably larger in the Cycle 23–24 minimum; however, the increased area can account for the reduction in the heliospheric magnetic-field strength in this minimum. Thus, the total magnetic flux contained in this region is the same in the two minima. Various correlations among the solar-wind mass flux and coronal electron temperature inferred from solar-wind charge states were developed for the Cycle 22–23 solar minimum. The data for the Cycle 23–24 minimum suggest that the correlations still hold, and thus the basic acceleration mechanism is unchanged in this minimum.
STELLAR MAGNETIC ACTIVITY CYCLES
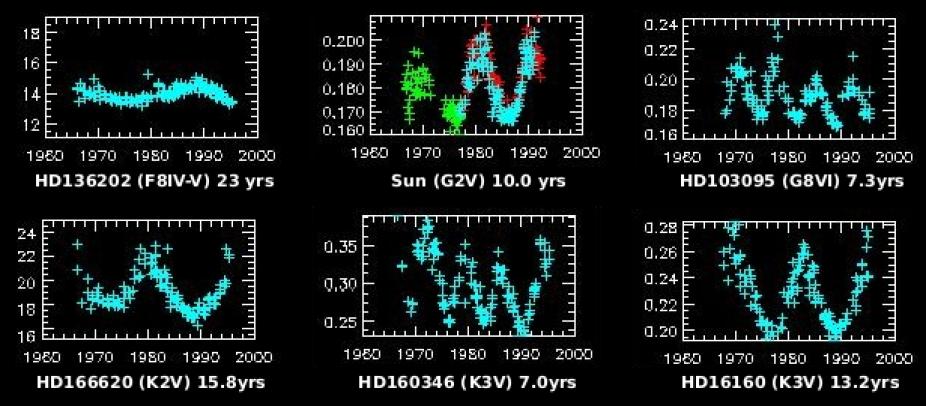
Figure 6: Examples of stellar magnetic activity cycles documented from long-term measurements of Ca II H and K emission in several Sun-like stars observed by the Mount Wilson survey (Baliunas et al. 1995) including the Sun measured with stellar techniques. The complete sample includes cycle periods ranging from 2.5 to more than 25 years, as well as some stars that currently appear to be in a Maunder Minimum phase.
Although we cannot observe spots on other solar-type stars directly, these areas of concentrated magnetic field produce strong emission in the Ca II H (396.8nm) and K (393.4nm) spectral lines. The intensity of the emission scales with the amount of non-thermal heating in the chromosphere, making these lines a useful spectroscopic proxy for the strength of, and fractional area covered by, magnetic fields (Leighton 1959). Wilson (1978) was the first to demonstrate that many solar-type stars exhibit long-term cyclic variations in their Ca II H and K emission, analogous to the solar variations (Figure 6). Early analysis of these data revealed an empirical correlation between the mean level of magnetic activity and the rotation period normalized by the convective timescale (Noyes et al. 1984a), as well as a relation between the rotation rate and the period of the observed activity cycle (Noyes et al. 1984b; Saar & Brandenburg 1999), which generally supports a dynamo interpretation.
In 2007, scientists at HAO initiated a survey of the brightest solar-type stars in the southern hemisphere, to complement the existing data from the northern surveys at the Mount Wilson and Lowell Observatories. With collaborators at Yale, Georgia State University, and the Space Telescope Science Institute, more than 50 stars are monitored monthly from the SMARTS 1.5m telescope at Cerro Tololo Interamerican Observatory in Chile, to monitor their Ca II H and K emission. Over the long term, these data will provide important new constraints on the physical mechanisms that drive the solar dynamo.
INTERNATIONAL CAMPAIGNS AND WORKING GROUPS
Event poster: The goal of IAU Symposium 286 was to consider solar and stellar minima.
Determining the solar origins and net impacts at the Earth of solar minimum differences requires coordinated, interdisciplinary modeling efforts to bring the pieces together. The current and last cycle minima were well-studied via international observational and modeling coordinated campaigns known as the Whole Sun Month (WSM) and the Whole Heliosphere Interval (WHI). The observations taken during these campaign periods were analyzed (and continue to be analyzed) via a series of workshops and special sessions at national and international meetings. The goals of these campaigns were to characterize the 3-D solar minimum heliosphere and to trace the effects of solar structures and activity through the solar wind to the Earth and other planetary systems, and beyond. The modus operandi of both WHI and WSM has been to coordinate comprehensive observations of the global heliosphere near solar minimum, including focused, quantitative observations designed to provide constraints on models of the Sun-Earth coupled system. Side-by-side modeling efforts then allow both intra-model and model-data validation and comparison. Results from WSM may be found in a special issue of the Journal of Geophysical Research Space Physics (May 1, 1999), and similarly results from WHI may be found in a topical issue of the journal "Solar Physics" on The Sun-Earth Connection near Solar Minimum.
As a means of extending the WSM and WHI legacy, an International Astronomical Working Group on Comparative Solar Minima was formed. The mission of this working group is to facilitate international and interdisciplinary research that focusses on the coupled Sun-Earth system during solar minimum periods, and to this end the working group organized and sponsored IAU Symposium 286, "Comparative Magnetic Minima: Characterizing Quiet Times in the Sun and Stars", which was held in Mendoza, Argentina from 3 to 7 October 2011. The goal of IAU Symposium 286 was to consider solar and stellar minima, from generative dynamo mechanisms to in-depth analyses from Sun to Earth for recent well-observed and modeled minima, to a range of stellar cyclic activity, to outlier "grand minima". Solar, heliospheric, geospace, atmospheric, stellar, and planetary sciences were included in the meeting's scope.