Magnetic Flux Emergence
Understanding the process of magnetic flux emergence through the solar convection zone is crucial for understanding the link between the observed magnetic activities at the surface and the dynamo-generated magnetic fields in the interior.
The current prevailing picture is that magnetic active regions on the solar surface originate from strong, predominantly toroidal magnetic fields generated by the solar dynamo mechanism at the thin tachocline layer at the base of the solar convection zone. Thus the magnetic fields need to traverse the entire convection zone (the outer 30% of the solar interior) before they reach the photosphere to form the observed sunspots and solar active regions, which are centers of solar eruptions. Understanding the process of magnetic flux emergence through the solar convection zone is therefore crucial for understanding the link between the observed magnetic activities at the surface and the dynamo-generated magnetic fields in the interior.
Using MHD numerical simulations, HAO scientists have modeled the formation and rise of buoyant of magnetic flux tubes in the solar convection zone and their emergence through the photosphere into the solar atmosphere.
Figure 1: A full disk magnetogram from the Kitt Peak Solar Observatory showing the line of sight magnetic flux density on the photosphere of the Sun on May 11, 2000. White (Black) color indicates a field of positive (negative) polarity.
If the magnetic field seen in sunspots and active regions on the solar surface originates from a large-scale, predominantly toroidal magneticfield generated at the base of the solar convection zone, then the process of how active region flux is transported through the convection zone and emerge into the solar atmosphere becomes a crucial link in the solar cycle dynamo puzzle. It is generally thought that magnetic flux rises buoyantly through the convection zone in the form of discrete flux tubes, and that the tubes should maintain reasonable cohesion in order that the emerging flux be organized as active regions, which display a well-defined order as described by Hale's polarity rule and Joy's law of active region tilts (Figure 1). Theoretical, numerical, and observational studies in the past 3 decades have greatly improved our understanding of the process, but have also raised many new questions. A review article on this subject can be found in Living Reviews in Solar Physics.
Buoyant rise of active region flux tubes in the solar interior
Figure 2: (a) 3D volume rendering of the magnetic field strength of a weakly twisted, rising Omega-shaped, whose apex is approaching the top boundary, resulting from a simulation described in (Fan 2008); (b) A cross section of |B| near the top boundary at r=0.937 R; (c) selected field lines threading through the coherent apex cross-section of the Omega-shaped tube.
Fan (2008) has carried out a set of 3D anelastic MHD simulations of the buoyant rise of active region scale flux tubes in a "quiescent" model solar convective envelope in a rotating spherical shell geometry. These simulations have considered twisted, buoyant toroidal flux tubes at the base of the solar convection zone with an initial field strength of 100 KG, being highly super-equipartition compared to the kinetic energy density of the convective motions, and thus have neglected the effect of convection. The main finding from these simulations is that the twist of the tube induces a tilt at the apex of the rising Omega-shaped tube that is opposite to the direction of the observed mean tilt of solar active regions, if the sign of the twist follows the observed hemispheric preference. It is found that in order for the tilt driven by the Coriolis force to dominate, such that the emerging Omega-shaped tube shows a tilt consistent with Joy's law of active region mean tilt, the initial twist rate of the flux tube needs to be smaller than about a half of that required for the tube to rise cohesively. Under such conditions, the buoyant flux tube is found to undergo severe flux loss during its rise, with less than 50% of the initial flux remaining in the final Omega-shaped tube that rises to the surface (Figure 2a).
It is also found that the Coriolis force drives a retrograde flow along the apex portion, resulting in a relatively greater stretching of the field lines and hence stronger field strength in the leading leg of the tube. With a greater field strength, the leading leg is more buoyant and remains more cohesive compared to the following leg (Figure 2a). Figure 2c shows selected field lines threading through the coherent apex cross-section of the final Omega-shaped tube, resulting from a simulation of a weakly twisted buoyant tube. It can be seen that the field lines in the leading side are winding about each other smoothly in a coherent fashion, while the field lines in the following side are significantly more frayed. The emergence of such an asymmetric tube may explain the observed more coherent leading polarity compared to the following polarity in an active region. Furthermore, the greater buoyancy and hence higher rise velocity of the leading leg in conjunction with its more coherent twist may give rise to a greater upward helicity flux in the leading polarity comparing to the following as a result of the emergence of the Omega-shaped tube. Such an asymmetry in helicity injection between the leading and following polarities of emerging active regions has been observed (Tian & Alexander 2009).
Flux emergence into the atmosphere, sunspot rotations, and the formation of a coronal flux rope
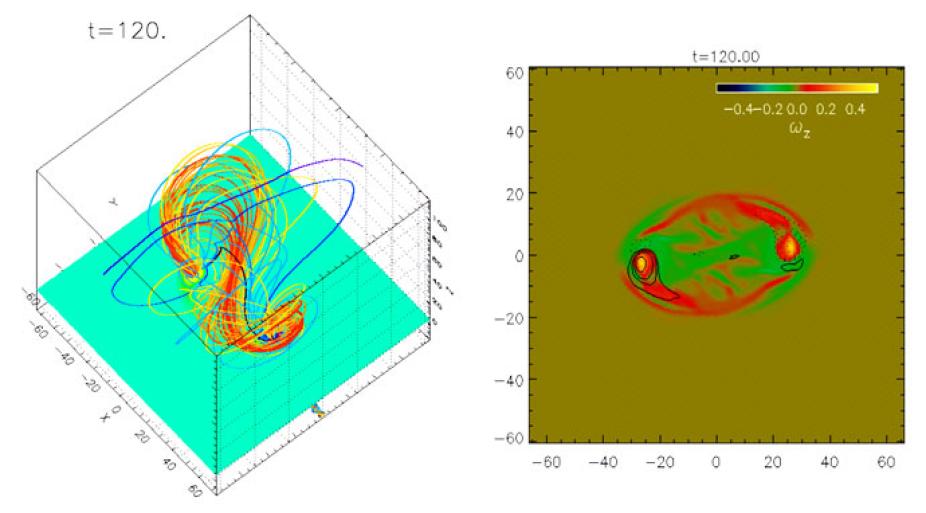
Figure 3: The left panel shows the 3D coronal magnetic field resulting from flux emergence. The black field line is the line going through the O-point of the transverse magnetic field in the central cross-section (at x=0), representing the new axis of the coronal flux rope structure. The right image shows the z-component of the vorticity on the photosphere overlaid with contours of Bz with solid (dotted) contours representing positive (negative) Bz. The image show counter-clockwise vortical motion (i.e. positive z-vorticity) centered on the peaks of the vertical flux concentrations of the two polarities.
Understanding how twisted magnetic fields emerge from the dense, convectively unstable solar convection zone into the stably stratified, rarefied solar atmosphere and corona is fundamentally important for understanding the formation of solar active regions and the development of precursor structures for solar eruptions such as flares and coronal mass ejections (Figure 3).
Fan (2009) has carried out 3D MHD simulations of the dynamic emergence of a twisted flux tube from the top layer of the convection zone into the solar atmosphere and corona. It is found that after an initial stage of flux emergence, during which the two polarity flux concentrations on the photosphere undergo a shearing motion and become separated, a prominent rotational/vortical motion develops within each polarity, reminiscent of sunspot rotations. This rotational motion persists throughout the subsequent evolution and steadily transports magnetic energy and twist into the atmosphere. It is shown that the initial shearing and the subsequent rotational motions of the two polarity flux concentrations twist up the inner field lines of the emerged field (near and include the original tube axis), causing them to rotate in the atmosphere from an initial normal configuration (i.e. arching over the polarity inversion line from the positive to the negative polarity), into an inverse configuration (i.e. directed from the negative polarity to the positive polarity over the neutral line). As a result, a flux rope with sigmoid-shaped, dipped core fields form in the corona, and the center of the flux rope rises in the corona with increasing velocity as the twisting of the flux rope footpoints continues.
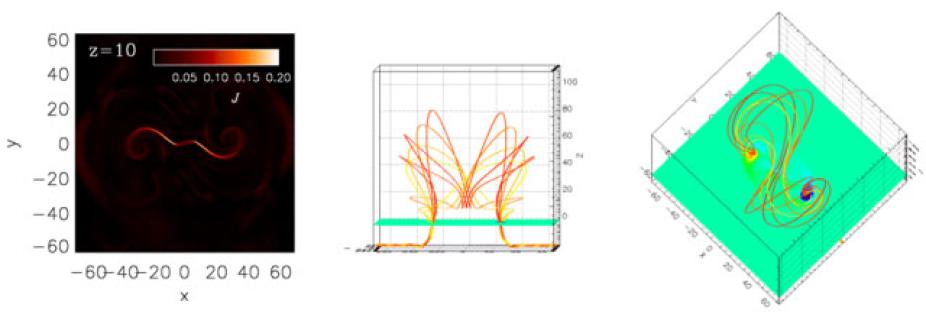
Figure 4: The left panel shows the electric current density in a horizontal plane at height z=10 in the chromosphere. The middle and right panels show two perspective views of a set of 3D field lines traced from a few points along the current concentration shown in the left panel.
A current sheet forms in the lower atmosphere, extending up to the base of the corona, with field lines going through it all showing sigmoid shapes. Heating in the current sheet may therefore cause these field lines to brighten up in X-ray as the observed sigmoid loops in active regions. Field lines going through the center portion of the current sheet undergo sharp dips. Reconnection in the current sheet allows for removal of the heavy plasma trapped in the dips and hence enhance the upward acceleration of the coronal flux rope (Figure 4).
It is shown that the rotational motions of two polarity flux concentrations on the photosphere are a manifestation of nonlinear torsional Alfven waves propagating along the flux tube, consistent with what has been predicted by an idealized analytical model (Longcope and Welsch2000). Due to the rapid stretching of the emerged magnetic field in the atmosphere and corona, the rate of twist per unit length along the coronal field lines drastically decreases. As a result, a gradient of the rate of twist is established along the flux tube from the interior into the atmosphere with the interior portion of the flux tube having a much higher rate of twist.
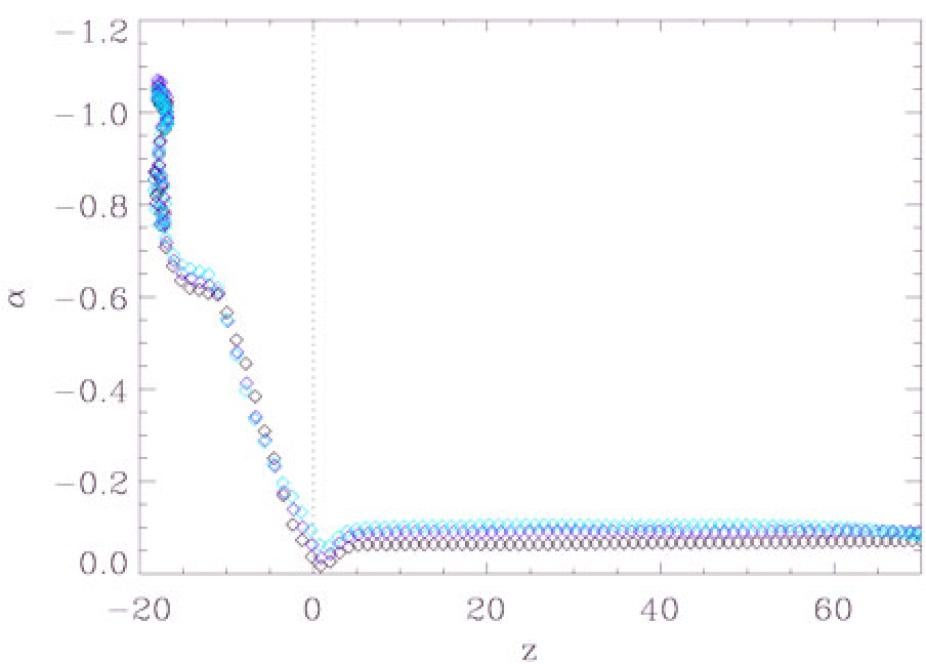
Figure 5: The variation of the rate of twist per unit length as a function of z along three field lines (distinguished by three different colors) in the neighborhood of the original tube axial field line, at a time near the end of the simulation when a coronal flux rope has formed.
This gradient in the rate of twist drives torsional waves along the flux tube, transporting twist from the interior highly twisted portion into the expanded coronal portion (Longcope and Welsch 2000}. Thus the rotational motion will continue until the coronal twist rate equilibrates with the interior twist rate along the field lines. The time scale for establishing the equilibrium is on the order of the Alfven transient time along the interior flux tube, which means that the rotational motion can persists for a few days after the initial emergence. Sunspot rotations have been observed in many events preceding X-ray sigmoid brightening and the onset of eruptive flares (e.g. Brown et al. 2003, zhang et al. 2008). Our simulations suggest that these rotational motions are due to non-linear torsional Alfven waves naturally occurring during the emergence of a twisted flux tube, and is an important means whereby twist is transported from the interior into the corona, driving the development of a coronal flux rope as a precursor structure for solar eruptions (Figure 5).