Solar Convection and Mean Flows
Any inquiry into the ultimate origins of solar magnetic activity must soon confront turbulent thermal convection. Convection is a means by which the Sun shines. Energy liberated by nuclear fusion deep in the core of the Sun filters outward by the diffusion of photons. In the outer approximately 30% of the Sun by radius, the solar plasma is cooler and more opaque, making radiative diffusion less efficient. Convection takes over as the primary mechanism by which energy is transported from 0.7 R to the solar photosphere, where it is radiated into space.
Convection in a rotating star not only transports energy, it also transports momentum, establishing global circulations and shearing flows. Such mean flows work together with turbulent convection to amplify, organize, and transport magnetic fields, converting kinetic energy to magnetic energy. This is the solar dynamo, where the chain of events that gives rise to space weather begins.
Turbulent Solar Convection
The surface of the Sun is blanketed by a patchwork of bright and dark patterns which changes continually, renewing itself every five minutes. Each bright patch is about 1000km across and is surrounded by an sinuous network of darker lanes. These are the telltale signs of thermal convection; hot plasma rises to the surface from below while cooler, denser plasma sinks. This surface convection is known as granulation and is readily observed with a moderate-sized optical telescope. Although they cannot be observed directly, researchers have long believed that larger scale convection cells lie deeper down—churning masses of plasma that are as much as 100,000km across—each ten times larger than the diameter of the Earth. These have become known under the evocative name of giant cells
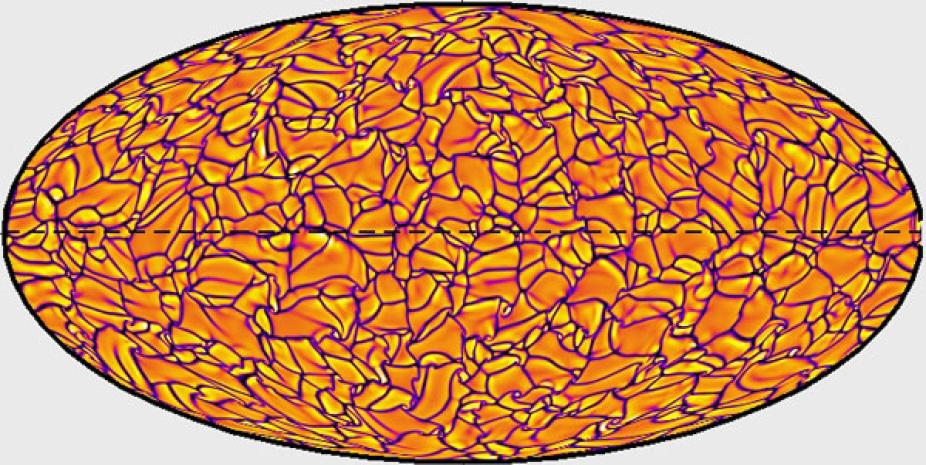
Figure 1: Convective patterns in a computer simulation of solar convection. Shown is a horizontal surface near the top of the convection zone in a Molleweide projection. Bright colors denote plasma flowing upward and dark colors denote plasma flowing downward.
The supercomputing resources required to numerically simulate solar convection are formidable. In order to exploit the latest generation of massively parallel computing architectures, HAO researchers and international collaborators have developed the ASH (Anelastic Spherical Harmonic) computer code, which solves the three-dimensional equations of magnetohydrodynamics (MHD) in rotating spherical shells with high spatial and temporal resolution. ASH simulations provide an unprecedented look into what giant cell convection in the deep interior of a star might be like (Figure 1). Radiative cooling near the solar surface produces relatively cool, dense plumes of plasma that are pulled down by gravity, creating an intricate, interconnected pattern of convection cells. The pattern is reminiscent of granulation but magnified 100 times. Closer scrutiny reveals further structure. At low solar latitudes, the downflow lanes exhibit a preferential north-south orientation, moving eastward relative to the surrounding plasma. Where lanes meet at higher latitudes, solar cyclones appear with a counter-clockwise swirl in the northern hemisphere (clockwise in the southern), only to disappear a few days later as they become subsumed into the global maelstrom.
Helioseismology and the Solar Internal Rotation
Although the interior of the Sun cannot be observed directly, solar internal dynamics may be probed by studying the behavior of sound waves in a research endeavor known as helioseismology. The Sun rings like a bell in millions of distinct tones, referred to as acoustic oscillation modes. Scrutinizing the frequencies of these oscillation modes provides information about the structure and dynamics below the surface. For example, as sound waves propagate through moving plasma, their frequency is shifted as a consequence of the Doppler effect. By carefully measuring such frequency shifts at the surface of the Sun, the flow below the surface may be mapped out. Computer models help to interpret such solar subsurface weather maps and inspire new helioseismic investigations. Similar techniques applied to other stars are referred to as asteroseismology.
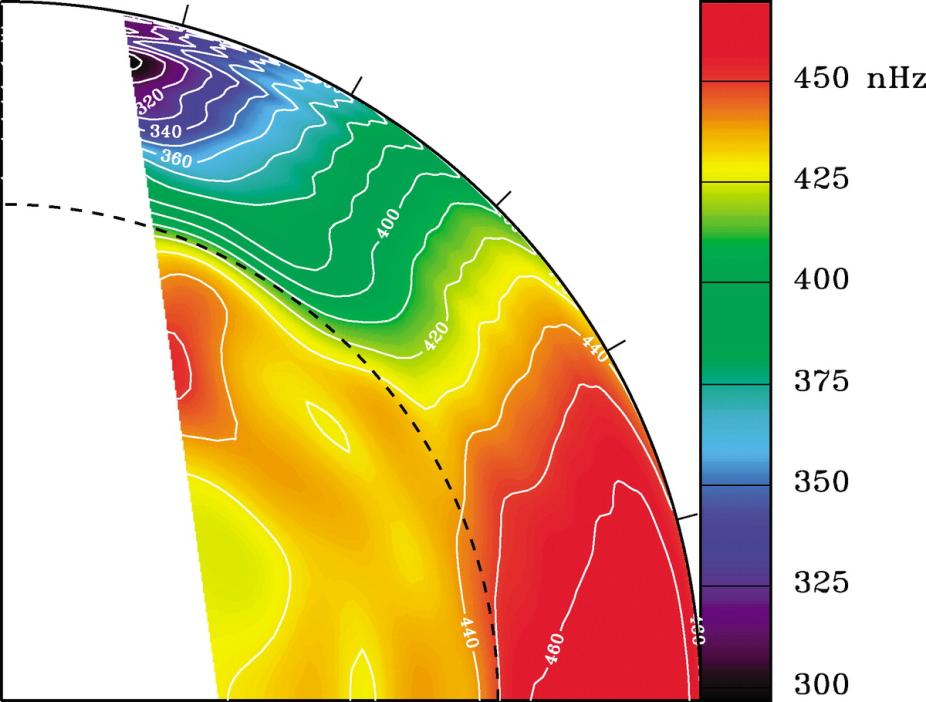
Figure 2: Internal rotation profile of the Sun inferred from helioseismology. Blue, green, and red represent progressively faster rotation as indicated in the legend. A rotation rate of 450 nHz corresponds to a rotation period of 26 days and 325 nHz corresponds to 36 days. The image extends from the solar equator on the lower right to the pole on the upper left (averaged over the northern and southern hemispheres).
Among the most remarkable triumphs of helioseismology is the inferred rotation profile of the solar interior (Figure 2). We have known for nearly two centuries that the surface of the Sun rotates differentially, with the rotation period increasing steadily from 25 days at the equator to about 36 days near the poles. Helioseismology now reveals that this rotation profile persists throughout the convection zone, with a sharp transition to nearly uniform rotation in the relatively quiescent radiative interior. The narrow transition layer is known as the solar tachocline (see below).
Shear, Magnetism and Global Circulations
The solar internal rotation profile inferred from helioseismology suggests that convection is be responsible for the differential rotation of the solar envelope. The convection zone rotates differentially whereas the radiative interior does not. Understanding how this rotation profile is established and maintained is one of the most compelling challenges of solar and stellar physics. HAO researchers face this challenge armed with several complementary numerical models, including 3D convection simulations and non-kinematic mean-field models that solve for mean flows as well as mean magnetic fields.
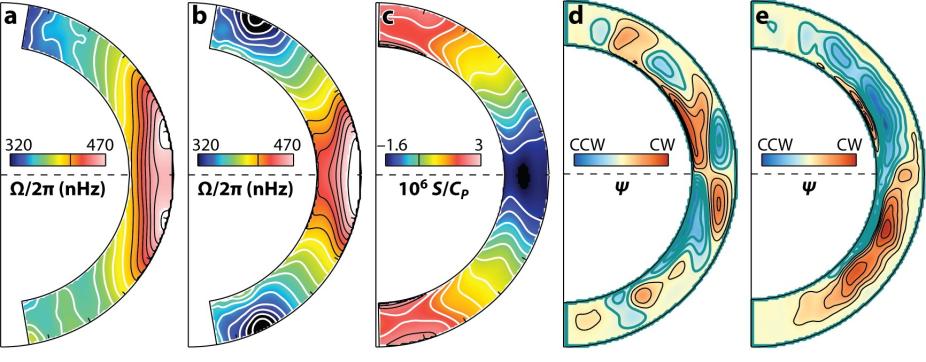
Figure 3: Mean flows versus latitude and radius in a representative selection of ASH solar convection simulations. Panels a and b show internal rotation profiles, panel c shows the latitudinal variation of the specific entropy per unit mass, and panels d and e show meridional circulation patterns, with lines indicating the direction of the mass flux and colors indicating its sense (red for clockwise, blue for counter-clockwise).
Such computer models indicate that the solar differential rotation comes about by means of a subtle nonlinear interplay between convective energy and momentum transport, rotational shear, axisymmetric circulations in the meridionial (radius-latitude) plane, and thermal gradients, meaning variations of temperature, density, pressure, and entropy with radius and latitude. The mean flows thus generated play an important role in the solar dynamo; rotational shear produces strong horizonal sheets and tubes of magnetic flux that ultimately emerge through the solar surface to form sunspots and active regions while the meridional circulation transports magnetic flux, thereby regulating the solar activity cycle (Figure 3).
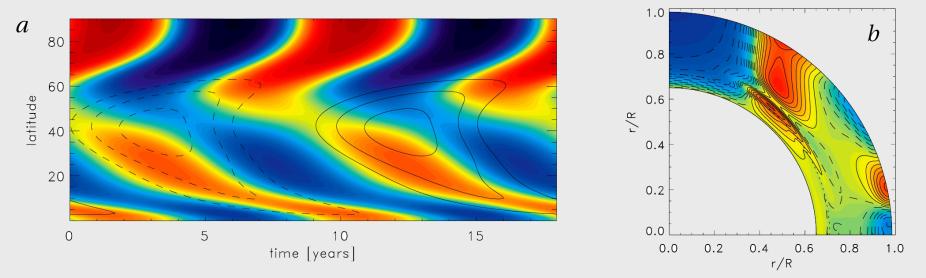
Figure 4: Non-kinematic mean-field solar dynamo model showing torsional oscillations in the solar convection zone. Red and blue represent plasma flowing eastward and westward respectively. Panel a illustrates how the alternating bands of eastward and westward flow vary with latitude and time while Panel b>shows their variation with latitude and radius at one instant in time.
Magnetism generated by convection, rotational shear, and meridional circulations can feed back on these flows in subtle and interesting ways, providing further clues into the origins and manifestations of solar magnetic activity. A notable example are the torsional oscillations; alternating bands of faster and slower rotation that drift toward the solar equator through the course of the solar activity cycle. HAO's non-kinematic mean-field dynamo models suggest that these originate by means of the combined influence of magnetic stresses and enhanced radiation in photospheric active regions (Figure 4).
The Solar Tachocline
One of the most striking features of the solar internal profile inferred from helioseismology is the solar tachocline; the sharp transition region between the differentially rotating convective envelope and the uniformly rotating radiative interior. The significance of the solar tachocline far outweighs its relatively small spatial extent. Although it only spans a few percent of the solar interior by radius, this is where sunspots and related active regions in the solar photosphere are thought to originate. Furthermore, the tachocline regulates the interaction between the convection zone and the deeper solar interior, with important implications for the rotational and compositional history of the Sun over its five billion year lifetime.
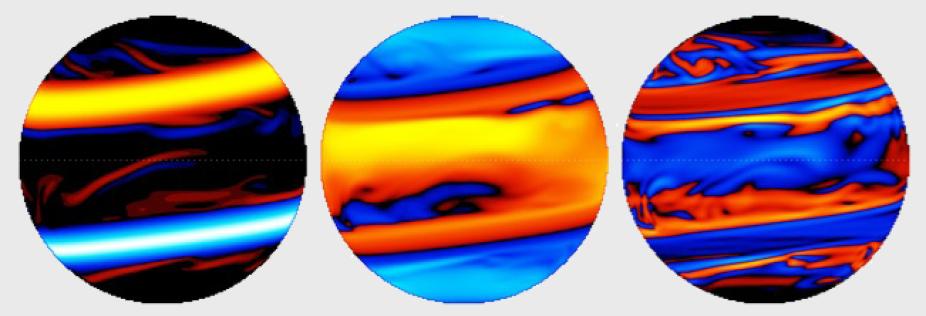
Figure 5: When a longitudinal band of magnetic flux is embedded in a region where the rotation rate varies with latitude, the band will tend to tip under certain conditions. The images above show a computer simulation of such a tipping instability. The left image shows the magnetic field after an initially east-west oriented band has tipped, with orange and blue denoting eastward and westward magnetic flux. The center and right panels show the velocity in the longitudinal direction and the vorticity variation associated with the tipping of the bands.
The solar tachocline is a rotating, stratified, magnetized shear layer and it exhibits a complex array of physical phenomena including turbulent penetrative convection, internal gravity waves, and a variety of MHD instabilities. HAO researchers investigate the diverse and enigmatic intricacies of the tachocline by means of multiple theoretical and computational modeling approaches, some designed to exploit the tachocline's thin radial extent. An example is shown in (Figure 5) which shows a 3D MHD simulation of the so-called tipping instability that arises when a horizontal loop of magnetic flux is embedded in a rotational shear flow. Such instabilities have also been studied both analytically and numerically using an MHD generalition of the shallow-water approximation originally developed for oceanic applications.
Stellar Differential Rotation
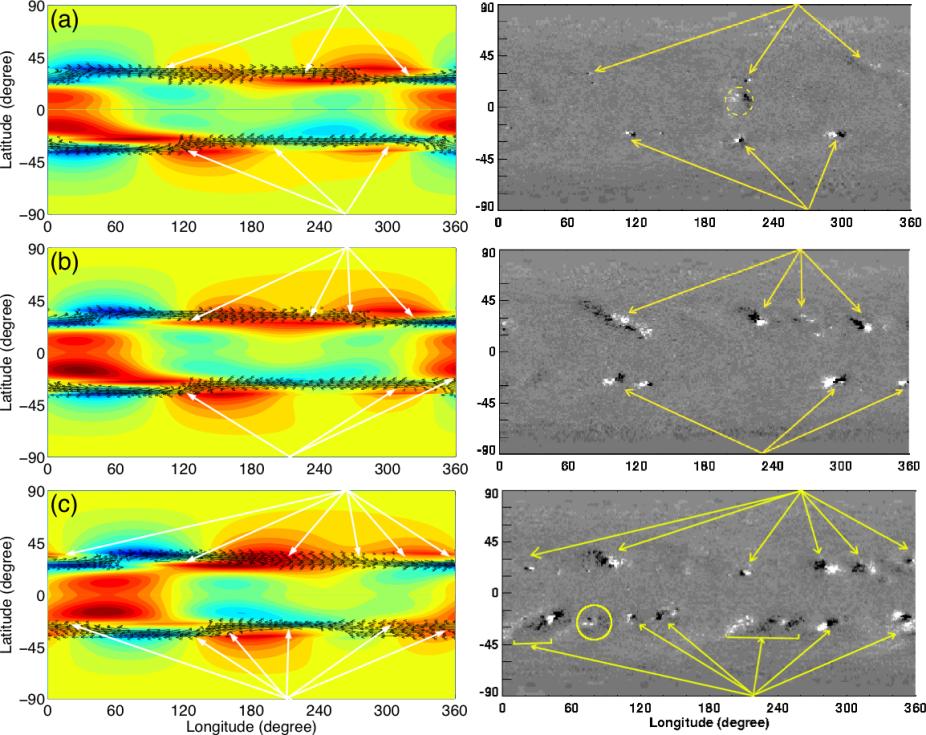
Figure 6: Top, middle and bottom frames in right represent observational synoptic maps of Kitt Peak magnetic field data at Carrington rotations 1921, 1927 and 1936; three theoretical synoptic maps on left are derived from superposition of m=1,S,A and m=2,A modes for a 20 kG toroidal band at times equivalent to 0, 6 and 15 Carrington rotations. Yellow arrows in the frames at right column denote new cycle spots; the spot inside the dotted circle in the top right frame is an old-cycle spot. White arrows in the frames at left column show the longitudes at which the spots errupted at the surface. The only spot that does not fall in a bulge (red area) is circled in the lower right frame.
Even without the short cadence data that is obtained for asteroseismology, the Kepler mission will yield high precision time-series photometry for many stars that will be sufficient to characterize the surface differential rotation through detailed spot modeling (Figure 6). The photometry will be precise enough to reveal the signature of individual star-spots rotating into view, and the continuous monitoring will show spots at different stellar latitudes lapping each other so their locations and rotation rates can be derived without ambiguity. The Kepler data will allow surface differential rotation measurements for up to 100,000 solar-type stars, and over the lifetime of the mission this may even allow the construction of rudimentary "butterfly diagrams" showing the migration of activity belts through some fraction of the stellar magnetic cycles.
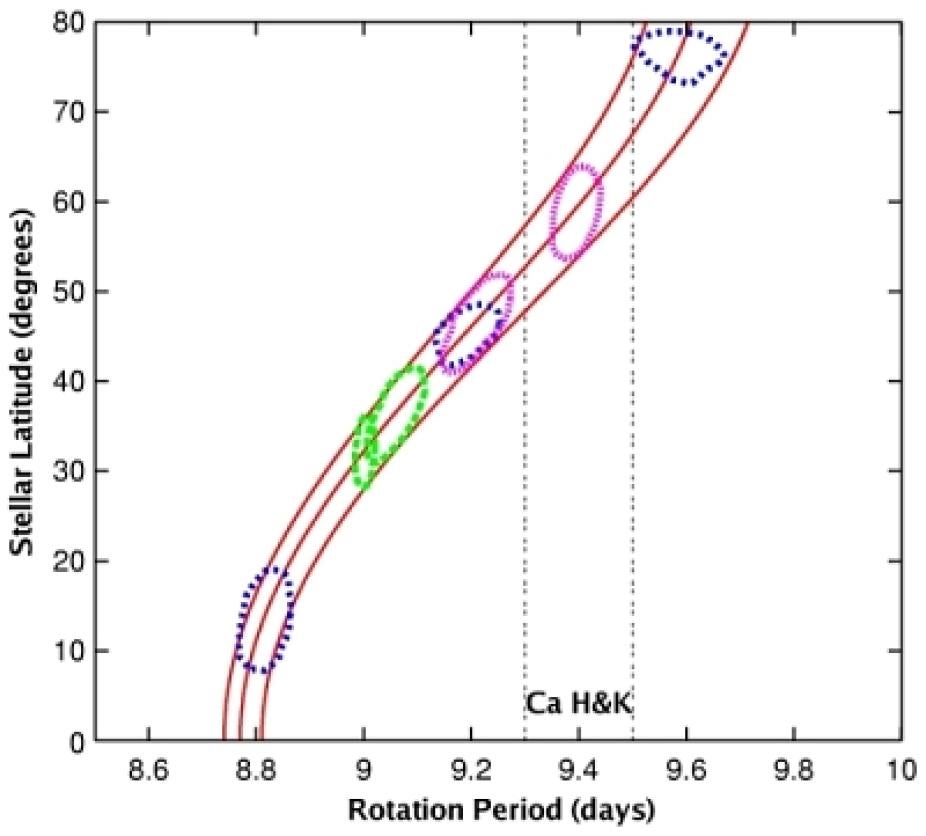
Figure 7: The rotation period of spots at various latitudes on the young solar-type star κ1 Ceti from observations by the MOST satellite in 2003 (green), 2004 (blue), and 2005 (pink), showing the same pattern of surface differential rotation as the Sun (red lines). The rotation period from ground-based observations of Ca II H and K emission is in the range shown by vertical dashed lines (adapted from Walker et al. 2007).
For the brighter asteroseismic targets where the individual oscillation frequencies are detectable, the time series should be long enough to resolve rotational splitting of the modes into multiplets for stars with rotation rates between about 2 and 10 times the solar rate (Ballot et al. 2008). Slower rotation makes it difficult to resolve the individual components of each multiplet from their strongly overlapping Lorentzian profiles, while faster rotation produces a splitting that is comparable to the small separation, creating some ambiguity in the mode identification. Measurements of the rotational splitting as a function of radial overtone can indirectly probe radial differential rotation, since the various modes sample slightly different (but overlapping) regions of the star (Figure 7). More directly, even with the limited set of low-degree oscillation frequencies that are available for distant stars, it is possible to construct inversion kernels that might detect a rapidly rotating core (Gough & Kosovichev 1993), although more recent work suggests that a significant detection may require unrealistically strong differential rotation (Chaplin et al. 1999).
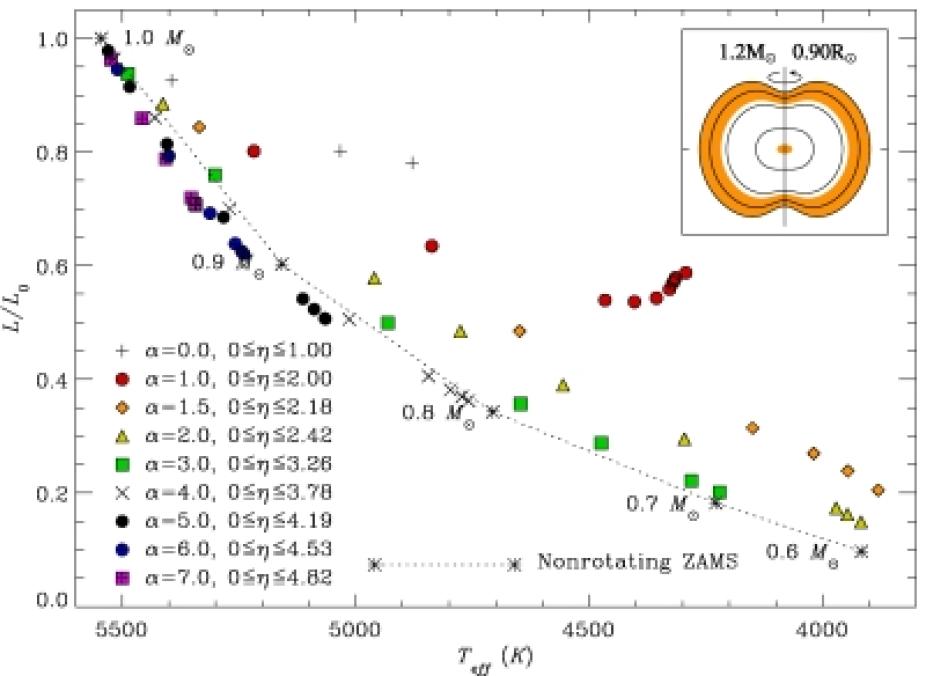
Figure 8: A theoretical H-R diagram showing the positions of various models of rotating stars with the same mass as the Sun. Some of the rapidly rotating models appear near the locations of zero age main sequence models for non-rotating stars (dotted line) creating a potential source of confusion. The inset shows the surface topology and convection zones for a rotating model with observable properties similar to the Sun (adapted from MacGregor et al. 2007).
The effects of rotation can modify many stellar properties, altering the luminosities, surface temperatures, sizes, and shapes of stars in ways that are unaccounted for in non-rotating models of stars. HAO scientists have developed methods for constructing self-consistent models of differentially rotating, chemically homogeneous stars, whereby the equations of stellar structure and Poisson's equation for the gravitational potential are iteratively solved for an assumed conservative internal rotation law. Such models provide a means of interpreting observations of stars that are known to be rapid rotators (Figure 8).