Sunspots and Photospheric Dynamics
Sunspots are the most prominent manifestations of magnetic field in the visible layers of the solar atmosphere. Their origin is a dynamo process operating in the solar convection zone. Magnetic field generated there over timescales typical for the solar cycle (~11 years) is transported toward the solar surface through a rapid flux emergence process leading to the formation of active regions. The typical size of sunspots is somewhat larger than the Earth's diameter, their magnetic field is with ~3,000 Gauss strength about 10,000 times stronger than the Earth's magnetic field. Such strong fields modify the convective energy transport leading to a central region (umbra) with predominantly vertical field and a brightness reduced to about 10-20% of that of the undisturbed solar surface. Even though the umbra appears dark compared to the solar surface, the temperature is still 4,000 to 4,500 K. The umbra is surrounded by a filamentary region (penumbra) with a brightness of about 75% (Figure 1). The latter region has strongly inclined field and exhibits large scale outflows of several km/s, the Evershed flow, named after its discoverer (Evershed 1909). At higher resolution the umbra of a sunspot shows fine structure on spacial scales similar to those observed in penumbral filaments. The umbra is not uniformly dark, but shows bright "umbral dots" with a diameter of a few 100 km. At highest possible resolution umbral dots show similar to penumbral filaments a central dark lane (Scharmer et al 2002) (Figure 1).
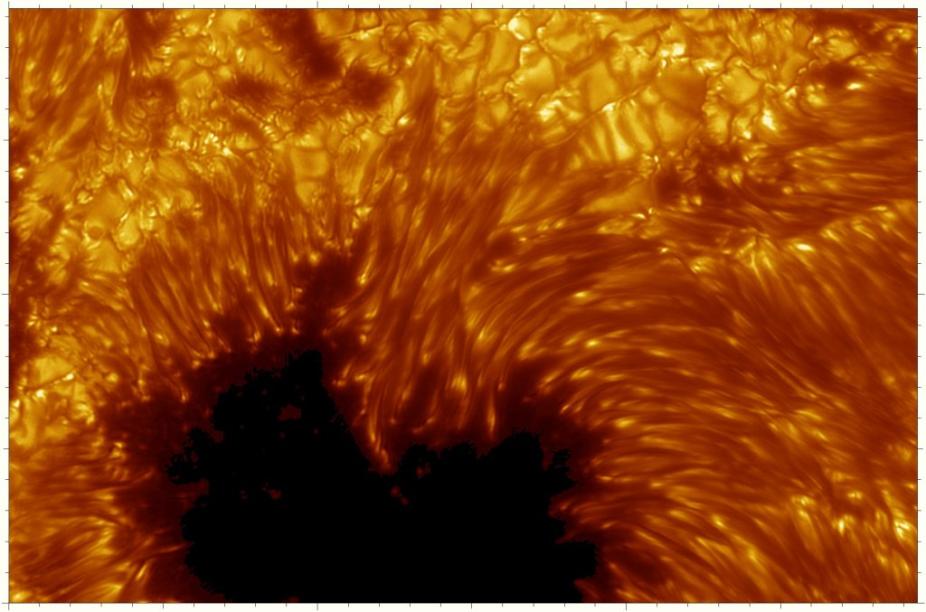
Figure 1: Sunspot observed with the Swedish Solar Telescope (SST). This image shows the transition from the dark umbra (bottom) toward solar granulation (top). The penumbra in-between shows filaments with central dark lanes. Credit: The SST is operated by the Royal Swedish Academy of Sciences, observation taken 2002 by G. Scharmer.
HAO scientists undertake state-of-the-art computer simulations of sunspots and are working to further enhance sunspot modeling capability by extending the computational domain of a typically observed active region both horizontally and vertically to more realistically simulate flux emergence into the chromospheres.
Radiative MHD simulations of sunspot structure
Performing computer simulations of entire sunspots is a challenging task. Sunspots have a typical size of several 10,000 km and show at the same time details down to the smallest observable scales of the order of a few 100 km. This combination of a large structure with much details requires large virtual computing domains which were out of reach for a long time. First attempts by Schüssler & Vögler (2006) focused on a detailed study of the umbra of a sunspot. Simulations including the transition from umbra toward granulation are more demanding and were first performed in 'slab' geometry, i.e. the simulation domain is a narrow rectangular cut through the center of a sunspot. Recently advances in supercomputing made also simulations of entire sunspots possible.
Simulations in slab geometry
Simulations of the transition from umbra toward granulation in 'slab' geometry were first introduced by Heinemann et al. (2007). In 2008 researches at HAO performed in collaboration with the Max Planck Institute for Solar System Research (MPS) in Germany a numerical simulation of filaments in the inner penumbra using a modified version of the MURaM solar MHD code (Rempel et al. 2009).
Figure 2 shows the formation and evolution of umbral dots in the center and a transition toward filaments with lengths of up to 3,000 km at the periphery. Both, umbral dots and filaments show a substructure with central dark lanes. During their formation phase filaments progress toward the umbra of the spot. Simulations in 'slab' geometry point toward a common magneto-convective origin of umbral dots and filaments in the inner penumbra. While umbral dots as shown by Schüssler & Vögler (2006) consist of instationary almost field free upflow plumes, the presence of more inclined field in the inner penumbra leads to symmetry breaking in the horizontal directions. The result are elongated filaments with reduced field strength and increased inclination angle embedded in a background of more vertical magnetic field. The evidence for an extended outer penumbra hosting a strong Evershed flow is very weak in slab simulations.
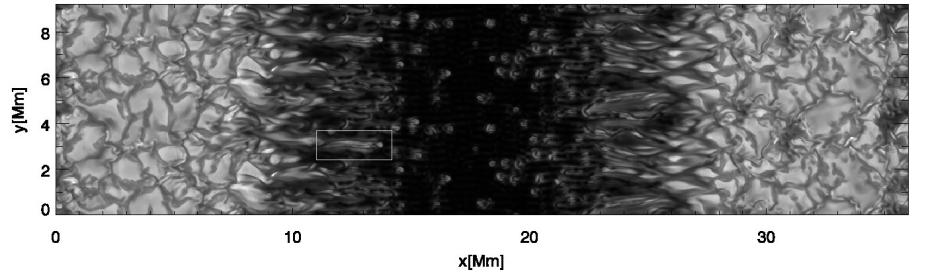
Figure 2: Intensity images from numerical simulation of sunspot in 'slab' geometry with about 20,000 km diameter (from Rempel et al. 2009). The computational domain has an extent of 36,000 times 4,600 km and is periodic in the horizontal directions shown, the image is doubled (linked movie is tripled) in the y-direction.
Simulations of full sunspots and spot pairs
Recent advances in supercomputing allowed scientists at HAO and MPS to perform the first comprehensive simulation of a pair of sunspots. The simulation domain encompasses a horizontal size of 98,000 times 49,000 km and a depth extent of 6,100 km. The computation including 1.8 billion grid points was performed on NCAR's new IBM Bluefire supercomputer.
The intensity image (Figure 3, top panel) shows extended outer penumbrae preferentially in-between the two sunspots in the x-direction where the neighboring opposite polarity spots lead to the formation of regions with almost horizontal field. The outer penumbra is somewhat subdued in the y-direction where the periodic boundary imposes same polarity spots. Both spots have different field strengths (left: ~3 kG, right: ~4 kG), leading to the formation of more umbral dots in the weaker spot on the left. The intensity movie shows an inward progression of filaments and peripheral umbral dots during their formation phase.
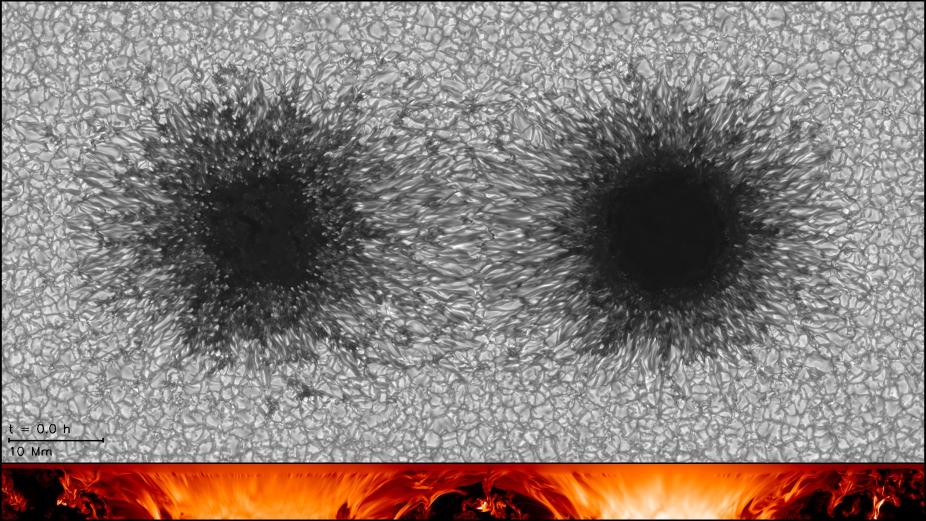
Figure 3: In black and white: Bolometric intensity. In color: Subsurface magnetic field strength on a vertical cut through the center of the spot pair, values range from 0 G (black) to 8 kG (white).
Evidence for mass flows away from the spots is present in the magnetogram movie (Figure 4, top panel), which shows bipolar magnetic structure diverging from both spots. In the center of the domain the outflows from both spots collide and form a large downflow lane, which is also visible in the evolution of the subsurface magnetic field shown (Figure 4, bottom panel). The umbral and penumbral fine structure is clearly visible in the magnetogram as regions with reduced vertical field strength (gray color).
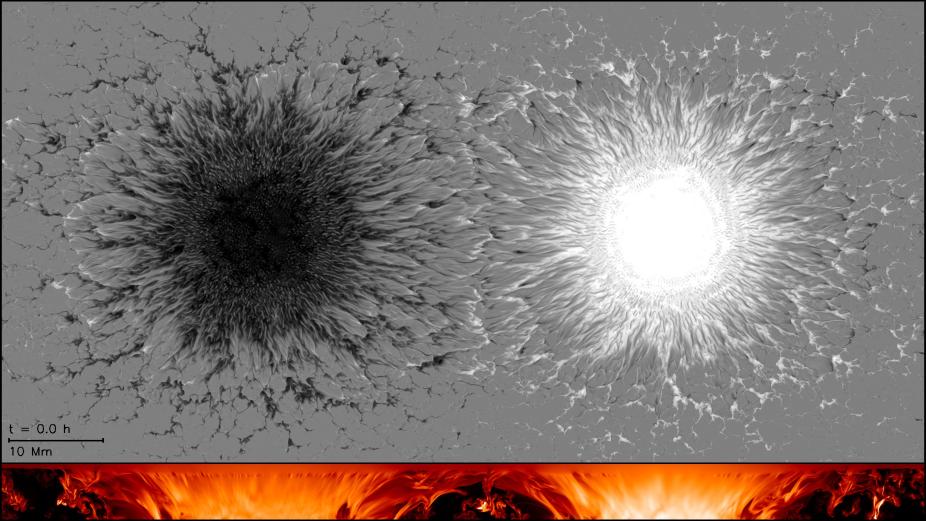
Figure 4: In black and white: Vertical magnetic field in solar photosphere (magnetogram), values range between -3.5 kG (black) and 3.5 kG (white). In color: Subsurface magnetic field strength on a vertical cut through the center of the spot pair, values range from 0 G (black) to 8 kG (white).
The magnetic field inclination in the photosphere (Figure 5, left image) shows the complex magnetic field structure in the transition from umbra toward penumbra. In the inner penumbra filaments with almost horizontal field (white colors) and rather low filling factor are embedded in a background with more vertical field (dark red). The outer penumbra is dominated with extended patches of horizontal field. In the latter regions we also observe the Evershed flow (Figure 5, right image) with peak velocities of up to 14 km/s.
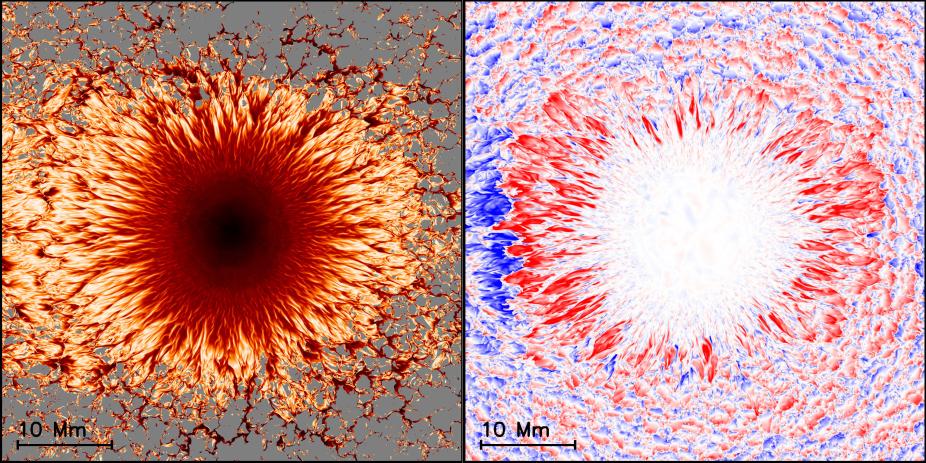
Figure 5: (left) Inclination angle of the magnetic field in the photosphere (right spot in simulation). Gray indicates regions with field strength < 200 G. (right) Radial flow velocity in photosphere. The color scale is saturated at +/- 8 km/s; red colors show outflows. The ring of red colored patches surrounding the spot shows the Evershed flow.
Structure of magneto convection in umbra and penumbra
Altogether numerical simulations indicate a new level of realism in the theoretical modeling of sunspot structure. The basic properties of the simulated umbral dots and penumbral filaments are consistent with a variety of observational results and provide a basis for a physical understanding of umbral and penumbral structure in terms of a common magneto-convective processes that is modulated by the varying inclination angle of the magnetic background field. Figure 6 displays the connection between magnetic field structure (vertical field strength [top left] and inclination angle [top right]) and flows in the photosphere (radial flow [bottom left] and vertical flow [bottom right]). Convective motions are present everywhere in the penumbra and they are the primary driver for the fine structure we observe. Upflows expand and weaken the magnetic field to a degree that enables overturning motions to take place. The convection affects the vertical field component stronger than the horizontal one, leading to filaments with increased field inclination angle. Horizontal flows are preferentially directed outwards. In the inner penumbra outflows are intermittent with velocities below 1 km/s. The outflows in the outer penumbra largely fill the space and reach several km/s. The presence of horizontal flows is manifest in the field structure (Figure 7): Fieldlines in the inner penumbra show only a small 'dip' close the photosphere, while fieldlines in the outer penumbra are bend over by the strong outflows.
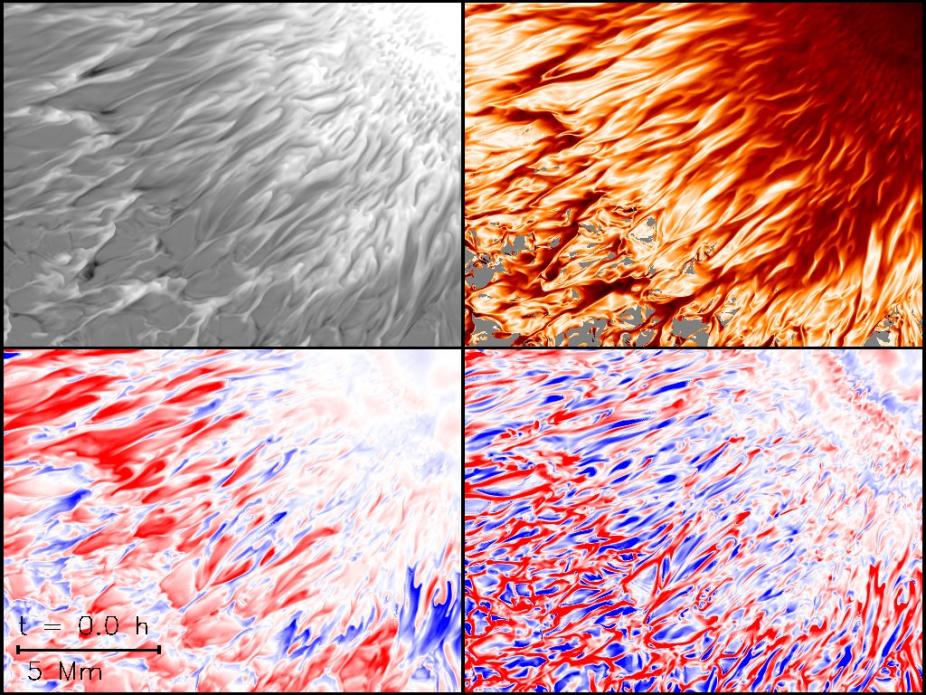
Figure 6: Transition from umbra (at right) to penumbra (at left). Quantities shown are in the photosphere. Top left: Vertical magnetic field component (white: upward, black: downward); Top right: Field inclination (black: vertical, white: horizontal); Bottom left: Radial flow velocity (red: outflows, blue: inflows); Bottom right: Vertical flow velocity (red: downflows, blue: upflows).
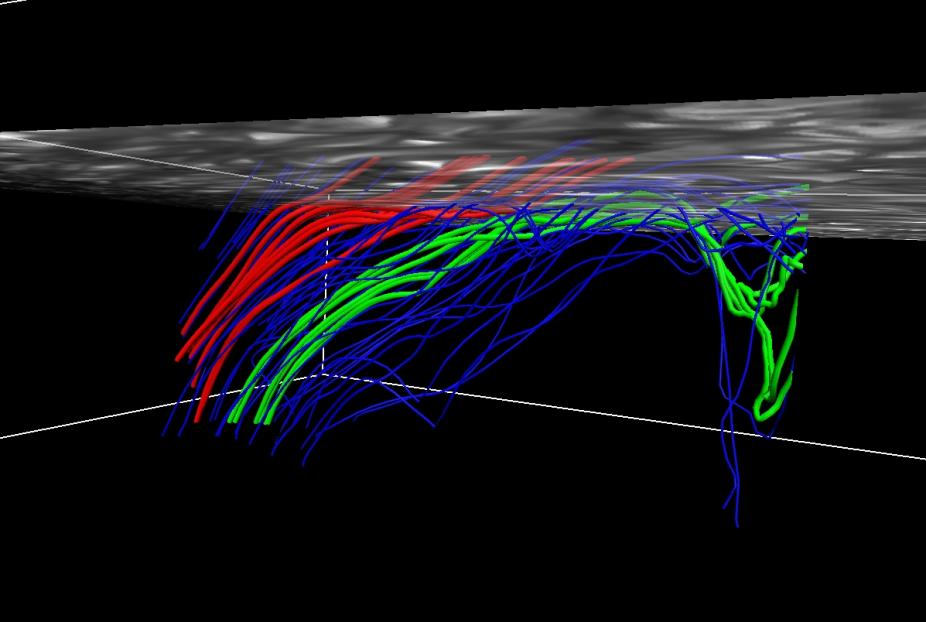
Figure 7: Frame from an animation of selected magnetic field lines in the penumbra of a simulated sunspot. Red: Filament in inner penumbra. The fieldlines become more inclined at photospheric levels, but continue upward toward the top boundary of the domain. Green: Filament in outer penumbra. The strong Evershed flow bends over field lines and the magnetic field is returning into the solar interior at the edge of the penumbra. Blue: Background field. The semi-transparent surface indicates the approximate location of the photosphere. The visualization was produced with VAPOR.