2026-04-01 Fast CME
Subtraction Movies
Figure 1: K-Cor subtraction movie of Apr 1, 2026 CME.
Discussion and Trajectory Plots
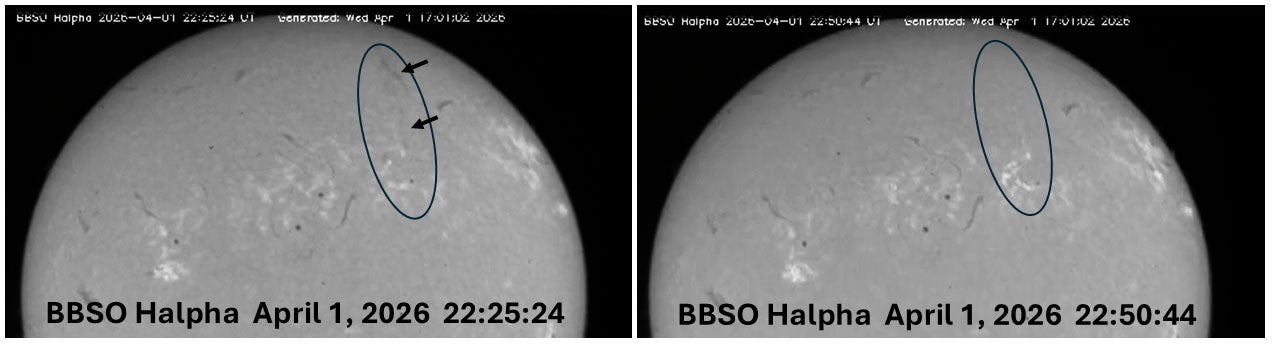
A fast CME was recorded by the MLSO K-Cor coronagraph on April 1, 2026, over the northwest limb of the Sun, shown in Figure 1 above. The CME consisted of the classic ‘3-part’ structure: outer loop, cavity, and inner core. The height of the CME leading edge was measured in K-Cor. A second-order polynomial fit to the data, shown in Figure 2a, resulted in a ‘final’ speed (i.e., speed at the highest height) of 844 +/- 107 k/s at 2.73 solar radii, as shown in Figure 2b, and with an acceleration of 414 +/- 24 m/sec2. Part of the inner core appears to be composed of material from an erupting filament/prominence visible in the northwest quadrant of the solar disk in NASA AIA data (see Figure 3). The filament was also seen to erupt in Big Bear Solar Observatory (BBSO) Hα images between 22:25 and 22:50 UT, shown in Figure 4. The erupting filament and associated magnetic reconnection regions were visible by AIA in all wavelengths. AIA 211 Å data show dimming in the northwest quadrant in the region of the eruptive filament (See Figure 5 movie).

Figure 2a (enlarge plot): CME height vs time as measured in K-Cor.

Figure 2b (enlarge plot): Derived linearly varying velocity from a 2nd-order polynomial fit (black asterisks). The 2nd-order polynomial fit was the best fit to the data.
The CME core was first visible in K-Cor subtraction images at ~22:40 UT. As the CME front formed, it became visible in K-Cor at 22:43 UT. The CME was also observed in the NASA LASCO and NOAA CCOR coronagraphs. CCOR images of the CME are provided in Figure 6.
This fast-moving CME produced a modest Solar Energetic Particle (SEP) event. NOAA GOES observed proton fluxes > 10 MeV. The integrated flux did not quite reach the Space Weather Prediction Center (SWPC) threshold for an S1 radiation storm. The Energetic and Relativistic Nuclei and Electron (ERNE) instrument onboard SOHO detected modest levels of protons with energies between 13 and 51 MeV. Proton flux plots from GOES and ERNE are provided in Figure 7a and Figure 7b respectively.

Figure 3 (enlarge image): Composite of K-Cor subtraction (b/w) and AIA 193 Å (gold) on April 1, 2026. The red arrow points to the prominence material seen in both K-Cor and AIA in the same apparent location.
The Artemis II mission launched from Kennedy Space Flight Center on April 1, 2026, at 22:35 UT. At that time, the filament was in the early stages of eruption, and the CME was not yet fully formed. It is fortunate that this CME did not drive a significant radiation storm that could have posed a hazard to the astronauts.

Figure 4 (enlarge image): Hα from BBSO on April 1, 2026. At left: Black arrows point to filament material along a N-S magnetic polarity inversion line at 22:25:24. At right: By 22:50:44 the filament has disappeared and brightening due to magnetic reconnection has occurred in the lower portion of the area defined by the black oval. A CME formed in MLSO K-Cor coronagraph between 20:40 and 20:43. Full disk halpha movies from BBSO can be found here:
https://bbsoweb.bbso.njit.edu.
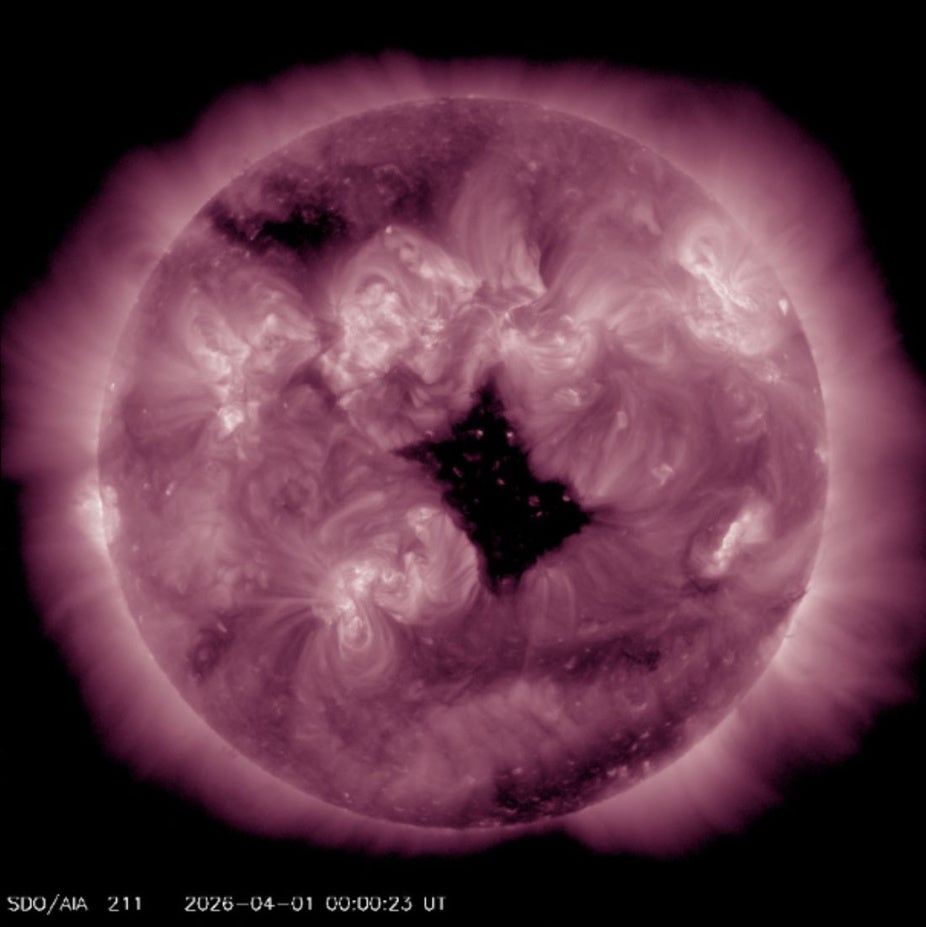
Figure 5 (play movie): AIA 211 Å daily movie on April 1, 2026.
Figure 5 is an AIA 211 Å daily movie on April 1, 2026. Dimming occurs between 22:39 and 22:59 UT in the northwest quadrant where the filament eruption occurred. Dimming increases in magnitude until ~23:40:11, by which time the CME front is at ~ 4 solar radii in LASCO C2. Dimming is a signature of the CME "footprint". AIA daily movies can be found at: https://sdo.gsfc.nasa.gov

Figure 6 (enlarge image): CCOR coronagraph observations on Apr 1, 2026. The figure at far left is the inner
field-of-view from a CCOR image at 23:15 superposed with K-Cor CME image at 23:15:26 to
illustrate that K-Cor observations fill in the early formation and dynamics of CMEs not visible in
CCOR. The CME is first visible in CCOR at 23:45 – second image from left. CCOR Level-1
products are available at: https://services.swpc.noaa.gov.

Figure 7a (enlarge plot): GOES proton flux following Apr 1, 2026 CME. The proton flux > 10 MeV generated by this event did not reach the SWPC S1 radiation storm threshold. GOES plots are courtesy University of Colorado Space Weather Technology, Research and Education Center (SWx-TREC). See https://lasp.colorado.edu.

Figure 7b (enlarge plot): Two-hour averaged proton flux > 13 to 26 MeV & > 26 to 51 MeV observed by the ERNE instrument on SOHO. For ERNE plots, see: https://carrington.srl.utu.fi.