2022 Coronal Magnetic Field Plane-of-Sky (POS) maps from MLSO UCoMP Observations
Courtesy of Zihao Yang
Description
Yang et al. 2024 used the Mauna Loa Upgraded Coronal Multi-Channel Polarimeter (UCoMP) observations to construct 8 months of plane-of-sky (POS) coronal magnetic field maps to determine the coronal magnetic field distribution with height and quantify the strength of the magnetic field over heights of 1.5 to 1.6 solar radii. Spherical distributions of the field were also constructed over different heights in the atmosphere. They found the field strength between 1.05 and 1.6 solar radii varies from < 1 to ~20 gauss. They also found a signature of active longitudes in the coronal magnetic field maps.
The Mauna Loa Upgraded Coronal Multi-Channel Polarimeter (UCoMP) observes full Stokes polarimetry (IQUV) in up to 9 coronal emission lines, including the 1074.7 nm and 1079.8 nm lines of FeXIII. UCoMP has a field-of-view (FOV) from 1.05 to 1.6 solar radii in the north-south direction and 1.05 to 2.0 solar radii in the east-west direction.
Click on movie to open full-res MP4 file.
Movie from Yang et al. 2024
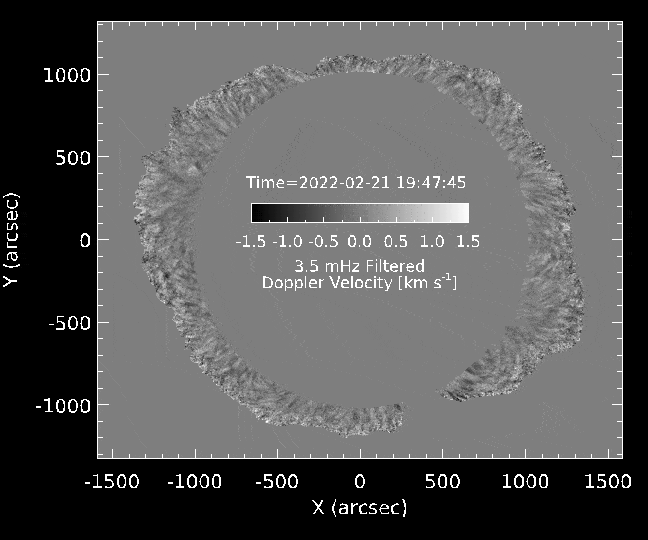
UCoMP provides a daily ‘waves’ program (weather permitting) that acquires 3 wavelengths across the FeXIII 1074.7 nm line for 1 hour at 30-second cadence to produce a Doppler velocity product used to track waves in the corona (shown in this figure) and determine their plane-of-sky (POS) phase speed. The FeXIII linear polarization provides the direction of the magnetic field in the POS. The waves are compared with the POS direction of the field to identify waves moving along the magnetic field (e.g. Alfven waves, kink waves).
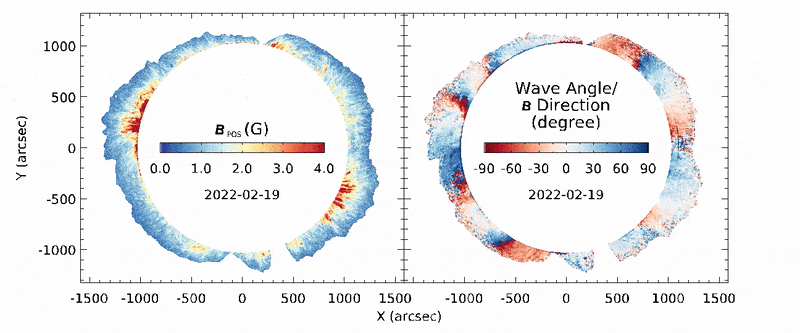
POS Coronal Magnetic Field Map and POS Direction
Click on movie to open full-res MP4 file.
Movie from Yang et al. 2024
The POS density is found from the ratio of 1074.7 and 1079.8 FeXIII line pair. The density and wave phase speed are used to derive the strength of the magnetic field in the POS. This is combined with the POS field direction from the linear polarization to produce a POS B-field map (shown in the figure above). Note that all quantities are integrated along the observer’s line-of-sight, as are all remote-sensing observations of the optically thin solar corona.
Evolution and Height Variation of the Magnetic Field
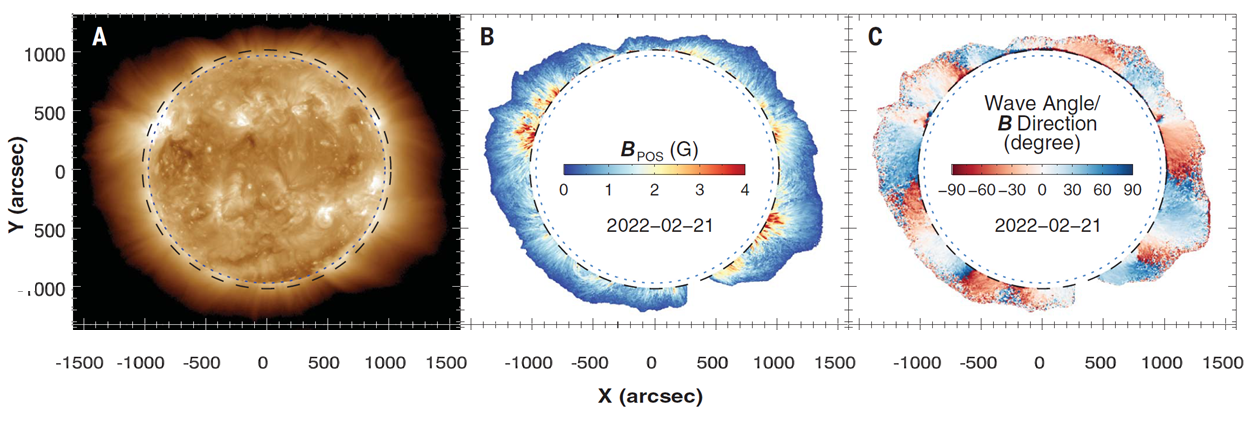
Feb 21, 2022 data from (A) SDO AIA 193 Å, (B) UCoMP POS magnetic field, (C) UCoMP POS magnetic field direction.
Adapted from Fig 1 Yang et al. 2024
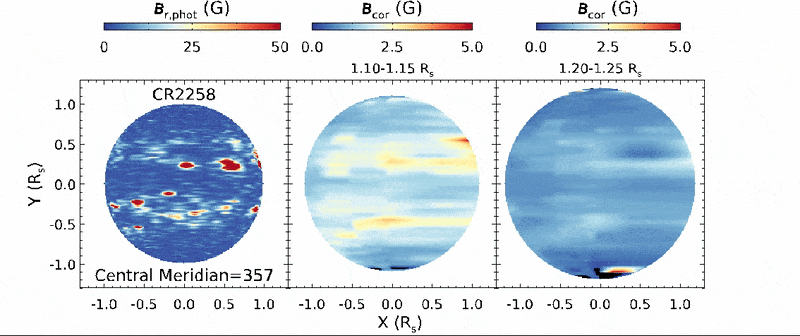
Yang et al. combined UCoMP, AIA and HMI observations to study the evolution and height variation of the magnetic field over 5 Carrington rotations. Fig 2 from Yang et al. (below) shows the photospheric magnetic field from HMI with UCoMP POS magnetic field and AIA intensity from 1.1 to 1.15 Rsun and from 1.20 to 1.25 Rsun.

Fig 2 from Yang et al. 2024
Spherical Construction of Magnetic Field with Height
Movie showing the variation of magnetic field strength with height from the photosphere in HMI (left) into the low corona from UCOMP. Active longitudes are visible in the movie. Click on movie to open full-res MP4 file.
Yang et al. 2024
For more info see the paper and supplemental file with movies
Zihao Yang, Hui Tian, Steven Tomczyk, Xianyu Liu, Sarah Gibson, Richard J. Morton, Cooper Downs, Observing the evolution of the Sun’s global coronal magnetic field over 8 months, 2024, Science, 386, pp 76-82
Full text from Publisher: https://www.science.org/doi/10.1126/science.ado2993
Preprint: arXiv:2410.16555: https://arxiv.org/abs/2410.16555