Mk II Coronal Activity Monitor Instrument
Description
The second K-coronameter developed by the High Altitude Observatory was known as the Coronal Activity Monitor and was later known as Mk II. The design drew heavily from the Mk I K-coronameter. Like the Mk I, the Mk II was an internally occulted white light coronameter designed to record the polarization brightness (pB) of the Thomson scattered K-Corona continuum emission at various coronal heights between 1.125 and 2.0 solar radii. The brightness of the polarized light was measured with a sensitive photoelectric polarimeter using electro-optic modulation of the light beam and a half-wave plate made of two quartz plates whose optical axes were crossed. Following the aperture stop the beam was modulated using a quarter-wave plate and a polaroid. The retardation of the beam was proportional to the voltage applied to the crystal. A cone with a small hole drilled along its axis isolated the region of the corona for scanning around the Sun. The Mk II contained a Lyot stop, an aperture stop, a Lyot spot and a calibration plate. An image of the Mk II instrument is shown in Figure 1.
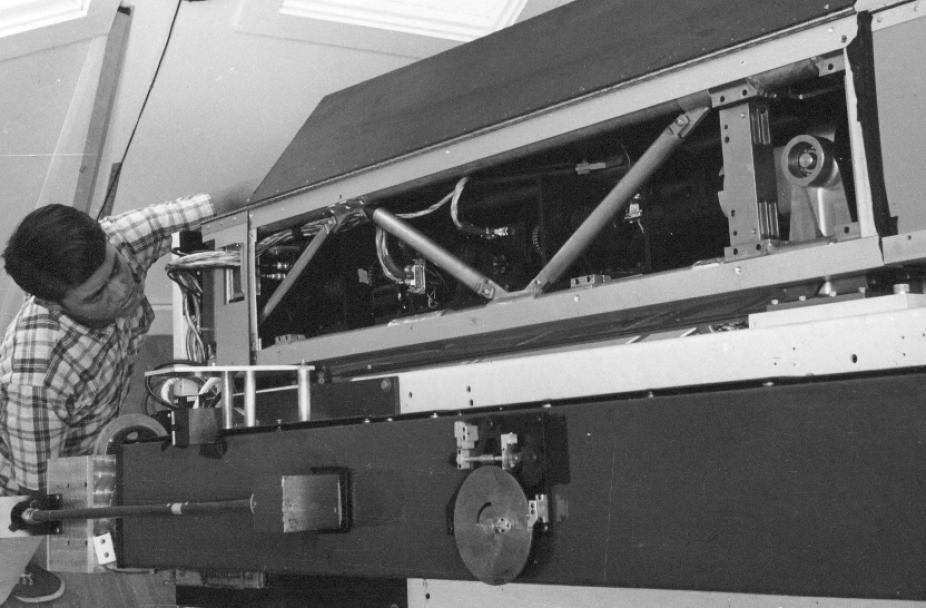
Figure 1. John Moore works on the Mk II Coronal Activity Monitor (telescope with the open panel) at the Mauna Loa Solar Observatory (MLSO) in 1970. The instrument on the MLSO spar below the Mk II is the Mk I K-Coronameter.
The Mk II had a larger aperture than the Mk I and took advantage of newer (1960s) photo-multiplier tubes that were more sensitive to red wavelengths where the sky brightness is lower, reducing background noise. The Mk II utilized an S-20 photo-multiplier tube centered at 620 nm. It was designed to scan more rapidly than the Mk I in order to detect rapid changes (a few minutes) in the solar corona to study solar transients, i.e. coronal mass ejections (CMEs). The Mk II was capable of continuous scanning around the Sun but unlike the Mk I, it was also capable of scanning back and forth over small regions of interest in the corona where solar activity was more likely to occur. When not in activity monitor mode, the Mk II scanned the entire corona at eight heights between 1.125 and 2 solar radii in height increments of 0.125 solar radii. It took 2 to 3 hours to acquire 360 degree scans at all 8 heights.
Additional information about the Mk I hardware and data scans relevant to the Mk II instrument can be found on the Mk I homepage.
Instrument Details
- 13 cm aperture
- Internally ‘occulted’
- Central wavelength: 620.0 nm
- Bandpass: 20 nm
- Spatial Sampling: 30 arcsec per ‘pixel’
- Spatial Resolution = 60 arcseconds
- Field-of-view: 1.125 to 2 solar radii
- Focal length: 272 cm
- Background Noise level 1. 10-08 B/Bsun
- Instrument polarization -03
Available Data
The Mk II Coronal Activity Monitor took scans of pB intensity. It did not take images of the corona. Daily scans at 1.5 solar radii are available as digitized synoptic maps in fits and gif format covering the later mission from May 1969 until September 1978.
Science Goals and CME Observations
The primary science goal for the Coronal Activity Monitor was to observe solar transients (i.e. CMEs) in the corona. The primary goal was met by a number of observations of rapid coronal brightenings, followed by depletions that is now known to be a common signature of CMEs. One such observation was reported by Hansen at al. 1971. Figure 2 is a composite of two figures from the Hansen 1971 paper. The image on the left shows 5 scans of coronal brightness at a height of 1.5 solar radii taken on August 11-12, 1970. The scan times are noted in Table 1. The figure on the right shows the Mk II pB intensity vs time superposed with the 80 MHz observations of a moving Type IV source from the Culgoora radioheliograph. The rapid coronal brightening followed by a depletion is most likely a CME and occurs at about the same time and location as the moving Type IV source, indicating the likely presence of a shock wave produced by a fast-moving CME. An X-ray flare was also observed around the same time as the coronal transient by the Solrad 9 instrument on Explorer 37. The flare began after 23 UT and peaked at 23:44 UT. This Mk II observation was published in July 1971, 5 months before the first ever CME images were recorded by the NRL OSO-7 coronagraph.
Figure 2. Left plot shows the Mk II pB of the east solar limb between 40 and 120 degrees position angle (PA) at a height of 1.5 solar radii. The time of each pB measurement is shown in Table 1. The figure on the right is a superposition of the pB intensities at 1.5 solar radii with a curve of the 80 MHz observations from the Culgoora radioheliograph vs. time. Peak radio emission occurred at the time of rapid coronal depletion and in the same location in the corona (~85 degrees PA). See Hansen et al. 1971 for details.
| SCAN NUMBER | TIME OF OBSERVATION |
| 1 | Aug 11 18:08 to 18:15 UT |
| 2 | Aug 11 22:05 to 22:16 UT |
| 3 | Aug 11 23:30 UT |
| 4 | Aug 11 23:37 to 23:50 UT |
| 5 | Aug 12 01:04 to 01:28 UT |
Table 1. Observation time of pB scans shown in left plot of Figure 2.
Observing Site
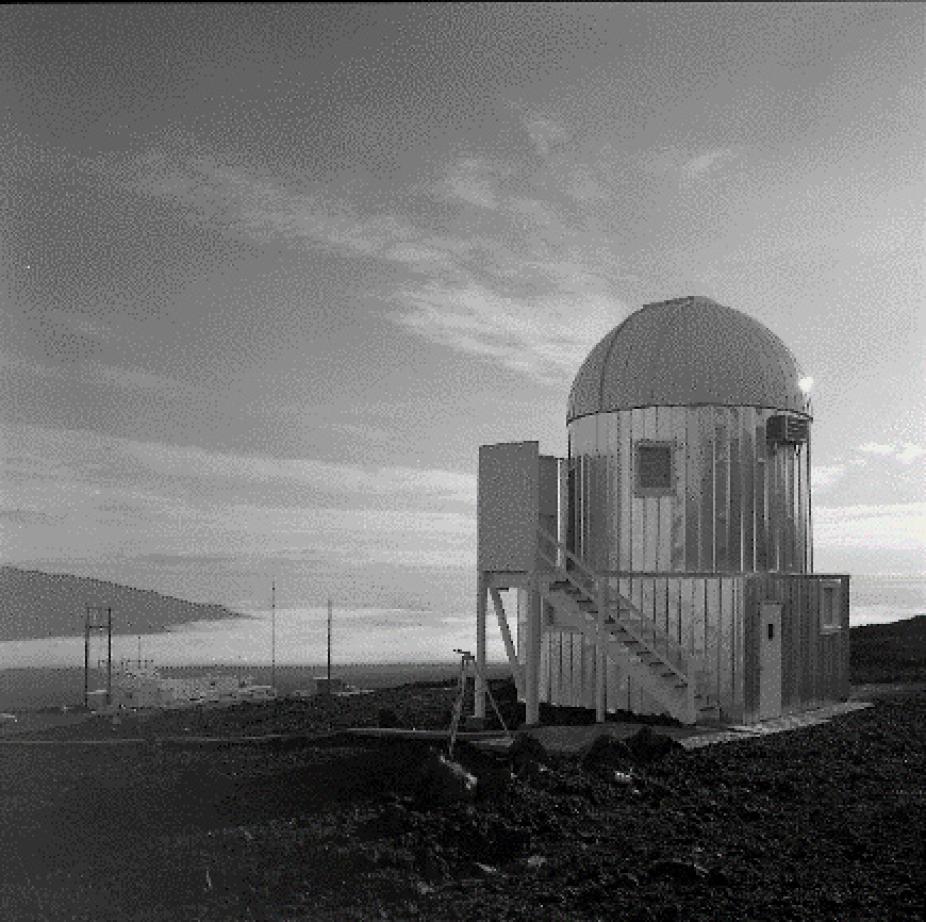
Figure 3. The Mauna Loa Solar Observatory (MLSO) in Hawaii in the mid-1960s. Continuous observations from Mk II began on May 26, 1969. It operated along with the Mk I K-Coronameter and an halpa imaging monitor until September 28, 1978. MLSO is located at 11,200 ft (3400 meters) on the northern flank of the active volcano of Mauna Loa.
The HAO Mk II Coronal Activity Monitor was installed on a 10-ft. equatorial spar at the Mauna Loa Solar Observatory in Hawaii (see Figure 3) in the spring of 1969. Continuous observations began on May 26, 1969. It operated along with the Mk I K-Coronameter and a halpa imaging monitor until September 28, 1978. Mk I and Mk II were replaced by the MK III K-Coronameter, which began operation in January 1980.