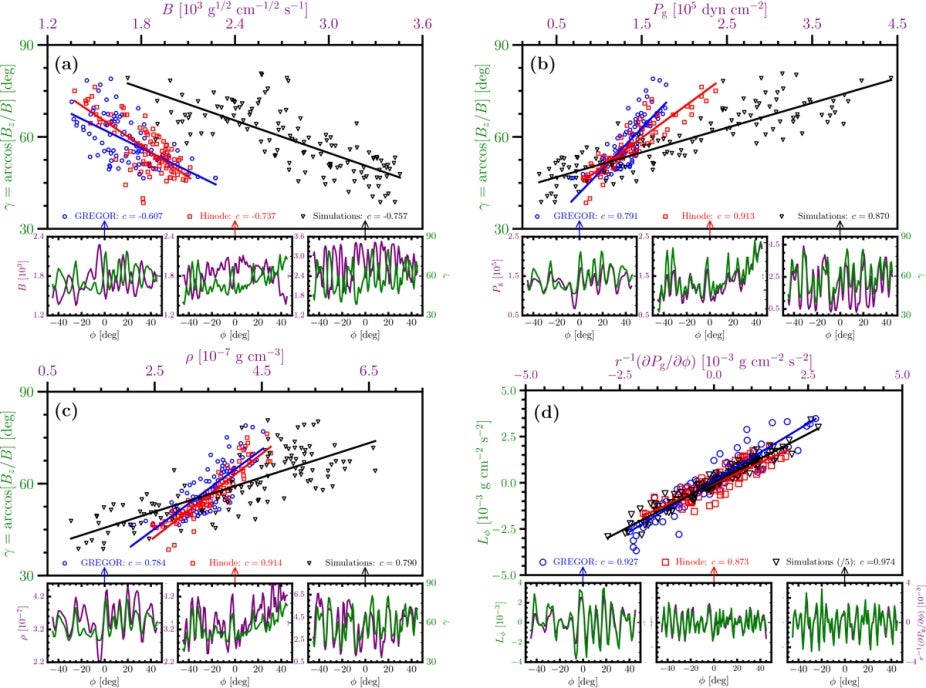
Scatter plots of the physical quantities in penumbra (extracted along an azimuthal arc) for GREGOR data (red squares), Hinode data (blue circles), and the MHD simulation (black triangles). Pearson correlations coefficients, c, for each of these pieces of data are provided in the legend. Linear fits to the data are shown with thick solid color lines. Upper left: γ − ∥B∥. Upper right: γ − Pg. Lower left: γ − ρ. Lower right: Lϕ − r−1∂Pg/∂ϕ. Each panel also includes three smaller subpanels in which the variations in the physical quantities along ϕ are displayed in purple and green colors. These subpanels are ordered as: GREGOR (left), Hinode (middle), and MHD simulations (right). This is also indicated by the arrows under the correlation coefficients for each data source. We note that the values of the ϕ components of the Lorentz force and of the gas pressure gradient in the simulations have been divided by five. The results demonstrate that, in the azimuthal ϕ direction, penumbral spines and intraspines are in almost perfect magnetohydrostatic equilibrium between the azimuthal components of Lorentz and pressure forces.
A recently published paper made quite a splash in the International and European news. Dr. Juan Borrero, of the Institute of Solar Physics (KIS) in Freiburg, led a team of scientists that included HAO's Matthias Rempel. The international team developed a new method for analyzing the stability of sunspots.
International:
Spain:
Mexico:
Germany: