Astrophysical Journal Letters: Active regions are the brightest structures seen in the solar corona, so their physical properties hold important clues to the physical mechanisms underlying coronal heating. In this work, we present a comprehensive study for a filament-embedding active region as determined from observations from multiple facilities including the Chinese Hα Solar Explorer (CHASE). The spectral resolution of CHASE is as high as 0.024 ̊A pixel−1, which enables an accurate determination of the chromospheric Doppler velocity that is especially crucial for probing the relative stable structure investigated here. We find three types of dynamic features which correspond to different thermal and magnetic properties during the investigated time period, i.e., the overlying loops – 1MK cool loops, the moss region – 2∼3 MK hot loops, and the sigmoidal filament. The overlying cool loops,which have potential field, always show Doppler blue shifts at the east footprint and Doppler red shifts at the west, indicating a pattern of ‘siphon flow‘. The moss brightening region – the hot loops in the vicinity of the filament, which have moderate sheared field, always shows downward Doppler red shifts at the chromosphere, which could be a signature of plasma condensing into the inner region adjacent to the filament. The sigmoidal filament, which have severe sheared field lines along the polarity inversion line, however shows a different Doppler velocity pattern in its middle part, i.e., an upward Doppler blue shift at the double-J shaped stage and then a downward red shift after the sigmoidal filament forms. The present work shows overall properties of the filament-embedding active region, constraining the heating mechanisms of different parts of the active region and providing hints regarding the mass loading of the embedded filament.

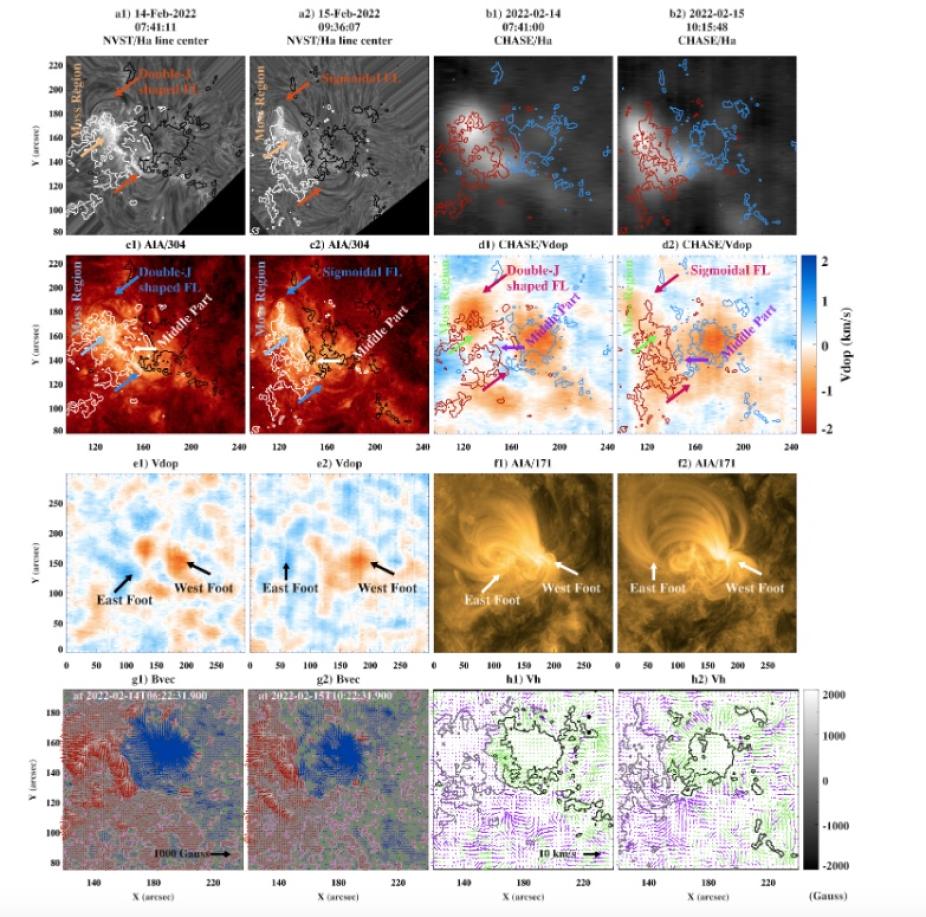
Overview of the observations at Feb 14 (panels (a1)-(f1)) and 15 (panels (a2)-(f2)) is shown in the lower panels. Hα line center images from NVST and CHASE are displayed in panels (a1)-(a2) and (b1)-(b2), respectively. Panels (c1)-(c2) show the images from AIA/304 ̊A, and Doppler velocities obtained from CHASE are displayed in panels (d1)-(d2). The contours show the LOS magnetic field (Blos) with threshold values of ±100 G. Doppler velocity and AIA/171 ̊A with a larger FOV are shown in panels (e1)-(e2) and (f1)-(f2), respectively. Panels (g1)-(g2) show the vector magnetic field, with vertical magnetic field (Bver) in the background and the horizontal field (Bhor) overlaid on top as arrows. Red arrows show Bhor at positive polarity and blue arrows show Bhor at negative polarity. Pink and grey contours of ±5 G of the Bver are overlaid. Horizontal flows at the photosphere obtained from DAVE4VM are displayed in panels (h1)-(h2) with purple arrows showing the velocity at positive polarity and green arrows at the negative polarity. Grey and black contours of ±100 G of the Bver are also overlaid.