ApJ: Matthias Rempel et al. present a method of conducting data-driven simulations of solar active regions and flux emergence with the MURaM radiative magnetohydrodynamics (MHD) code. The horizontal electric field that is derived from the full velocity and magnetic vectors is implemented at the photospheric (bottom) boundary to drive the induction equation. The energy equation accounts for thermal conduction along magnetic fields, optically thin radiative loss, and heating of coronal plasma by viscous and resistive dissipation, which allows for a realistic presentation of the thermodynamic properties of coronal plasma that are key to predicting the observational features of solar active regions and eruptions. To validate this method, the photospheric data from a comprehensive radiative MHD simulation of solar eruption (the ground truth) are used to drive a series of numerical experiments. The data-driven simulation reproduces the accumulation of free magnetic energy over the course of flux emergence in the ground truth with an error of 3%. The onset time is approximately 8 minutes delayed compared to the ground truth. However, a precursor-like signature can be identified at the correct onset time. The data-driven simulation captures key eruption-related emission features and plasma dynamics of the ground truth flare over a wide temperature span, from log10T=4.5 to log10T>8. The evolution of the flare and coronal mass ejection as seen in synthetic extreme ultraviolet images is also reproduced with high fidelity. This method helps to understand the evolution of magnetic field in a more realistic coronal environment and to link the magnetic structures to observable diagnostics.
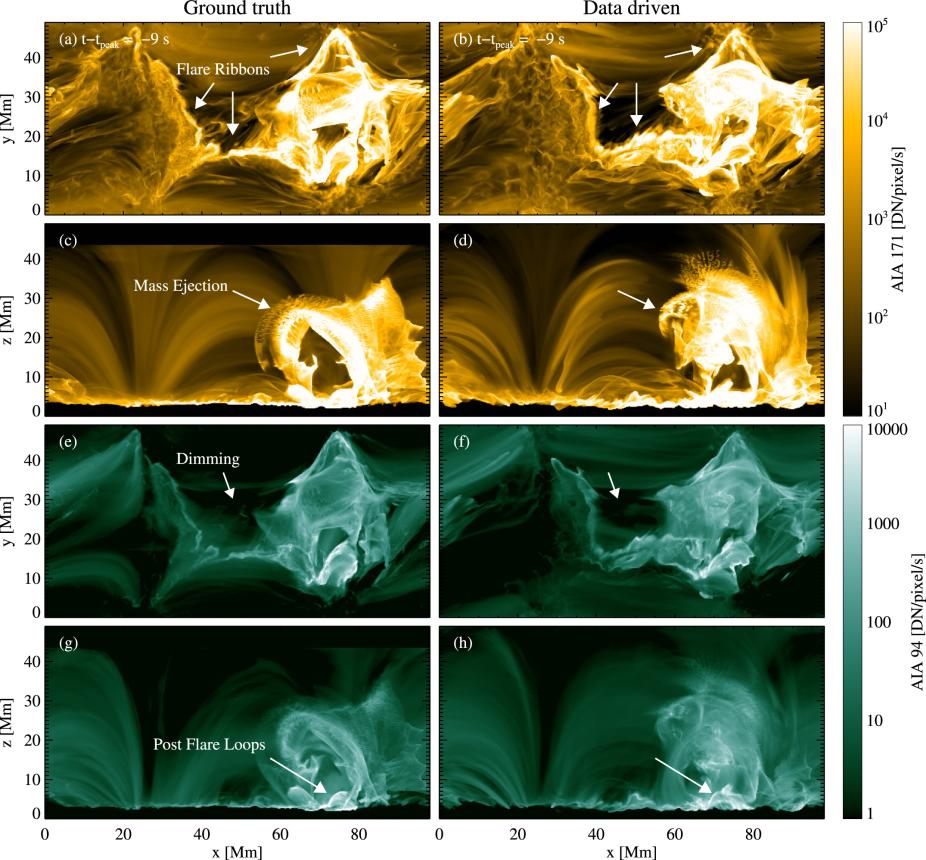
Comparison of the emission features in the ground truth (left-hand column) and data-driven (right-hand column) simulations. (a) and (b): Synthetic AIA 171 Å channel images from a top view along the z-axis. (c) and (d): Synthetic AIA 171 Å channel images from a horizontal view along the y-axis. (e) and (f): Synthetic AIA 94 Å channel images from a top view along the z-axis. (g) and (h): Synthetic AIA 94 Å channel images from a horizontal view along the y-axis. Arrows indicate some key features of the flare following Supplementary Figure 5 of Cheung et al. (2019).