Authors: Matthias Rempel, Georgios Chintzoglou
We present a data-inspired simulation of NOAA active region AR 11158. We simulate the formation of a collisional polarity inversion line (cPIL) by moving sunspots in a quadrupolar configuration along the centroid positions extracted from AR 11158. This process builds up free energy in the corona exceeding 4 × 10³² erg, out of which about 2 × 10³² erg are released in an X-flare followed by a series of smaller flares in the B to M range. The 4 strongest flares are associated with coronal mass ejections. About 1–2 hours prior to the X-flare a magnetic flux rope (MFR) is forming above the cPIL. About 5 minutes before the flare an upflow at chromospheric heights indicates a rise of the MFR. The eruption starts when parts of the MFR enter regions with a decay index larger than 1.5, indicating that the flare initiation is consistent with the torus instability. Comparing the series of flares in this simulation to properties of observed flares, we find a comparable trend between flare energy and GOES X-ray flux, but flare duration falls into the short end of the observed solar distribution. As a consequence, energy fluxes into the flare ribbons can be substantial, reaching 10¹³ erg cm⁻² s⁻¹ for the simulated X-flare. The X-flare causes step-function-like changes of the horizontal magnetic field in the photosphere, a propagation of a momentum pulse into the convection zone and quasi-periodic pulsations in the volume of the corona with periods from sub-seconds to multiple 10 seconds.
Preprint at Arxiv
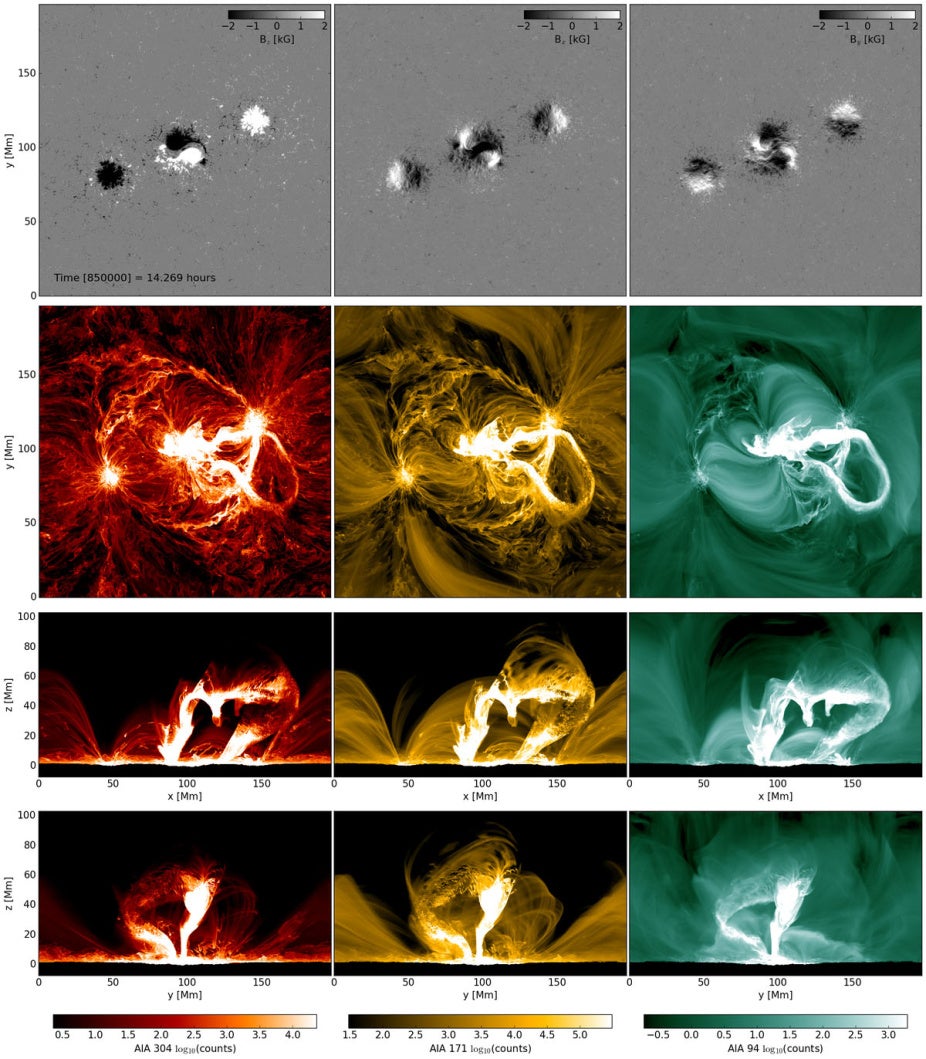
Top row: Photospheric (tau=0.1) magnetic field: B_z, B_x, B_y. Second row: Synthetic AIA emission in the 304, 171, and 94 passbands for a top view. Third and fourth rows: AIA emission for view along y-axis and x-axis, respectively. We show a snapshot at t=14.269 hours, which shows the ejection of a CME following an X-flare.