Authors: Kok Leng Yeo, Sami K. Solanki, Matthias Rempel, Anusha Bhasari, Natalie A. Krivova, Alexander I. Shapiro, Rinat V. Tagi
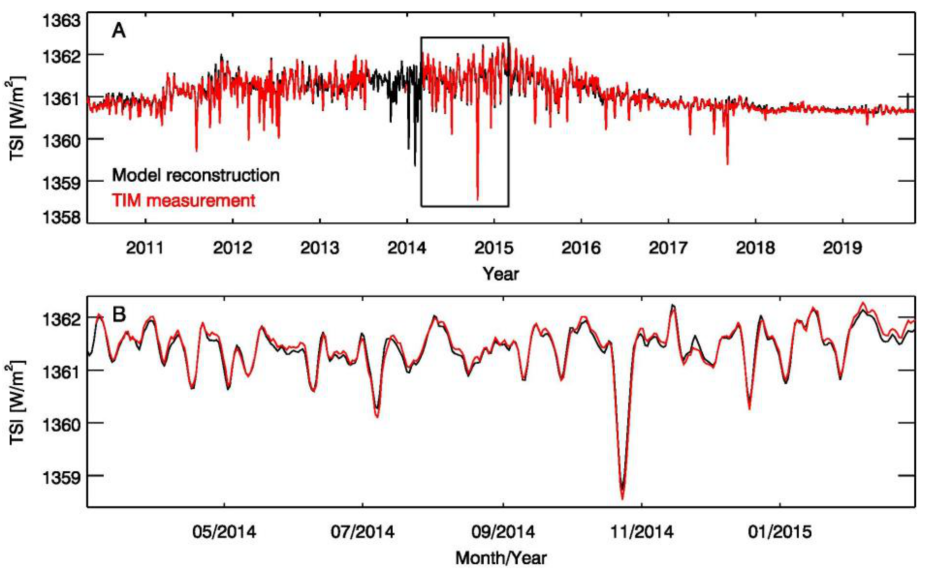
Measured and modelled total solar irradiance. (A) The model reconstruction of TSI (black) based on 3D MHD simulations and solar imagery from the Helioseismic and Magnetic Imager onboard the Solar Dynamics Observatory, which operated from 2010, and the measurements from the Total Irradiance Monitor onboard the SOlar Radiation and Climate 5 Experiment (red), which monitored TSI over the same period except between August 2013 and February 2014. (B) A blowup of the boxed period, 1 March 2014 to 28 February 2015, which encompasses the maximum of solar cycle 24, which occurred in April 2014. The root-mean-square difference between the two time series is 0.068 Wm-2 and the Pearson’s correlation coefficient is 0.987, i.e., the model replicates about 97% of the apparent variability in the TIM 10 record.
How the solar electromagnetic energy entering the Earth’s atmosphere varied since pre-industrial times is an important consideration in the climate change debate. Detrimental to this debate, estimates of the rise in total solar irradiance, TSI, between the Maunder minimum, an extended period of weak solar activity preceding the industrial revolution, and the last solar 15 cycle minimum in 2008 differ markedly, ranging from 0.4 to 6 Wm-2. As a consequence, the exact contribution by solar forcing to the rise in global temperatures over the past centuries remains inconclusive. Adopting a novel approach based on state-of-the-art solar imagery and numerical simulations, we establish that TSI could not have risen since the Maunder minimum by more than 2.1±0.7 Wm-2, restricting the role of solar forcing in global warming.
Link to publication: Geophysical Research Letters