Journal of Geophysical Research: This paper presents a quantitative assessment of the thermospheric forcing and its dependence on high-latitude driving is provided. Due to its coupling with the ionosphere via ion-neutral collisions, the simulated neutral wind and the corresponding thermospheric forcing from Global Circulation Models (GCMs) are highly dependent on the model's high-latitude ionospheric input. To study the effects of the different ionospheric inputs, we simulate the thermospheric winds using the Thermosphere-Ionosphere-Electrodynamics GCM (TIE-GCM) and compare them to the observed neutral wind vectors from the Scanning Doppler Imagers located in central Alaska during the St. Patrick’s Day storm in 2013. To assess the model-data discrepancies, the standard root-mean-square error (RMSE) is calculated, as well as the cross-correlation coefficient to better capture the structural differences between the simulated and observed winds. Additionally, individual thermospheric forces are analyzed, providing a full diagnosis of the relative importance of each force on the neutral wind behavior. It was found that the realistic high-latitude input resulted in better simulations of neutral wind structures than the empirical model did, although there was a slightly higher magnitude error. Altering the auroral energy flux mostly affected the resulting neutral wind speeds while the wind structures remained about the same. In the zonal direction, ion-drag is the dominant force, with significant contributions from the horizontal advection force and secondary contributions from the Coriolis and pressure-gradient forces. In the meridional direction, pressure-gradient is the dominant force, with secondary contributions from the ion-drag force and minor contributions from the Coriolis, horizontal advection and viscosity forces.
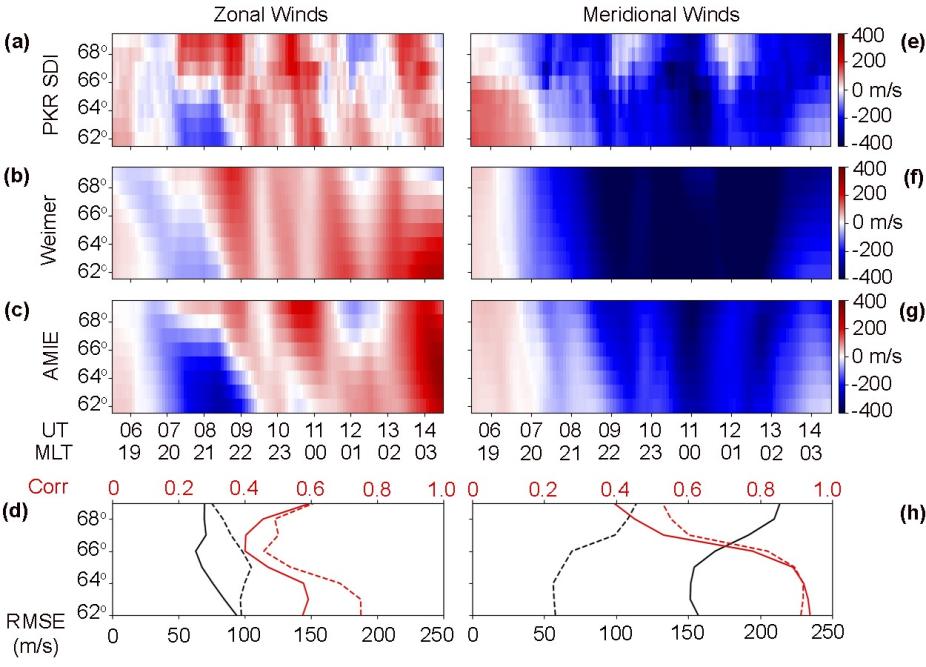
From top to bottom are (a and b) zonal and meridional neutral winds observed by the Poker Flat SDI, (b and f) modeled by Weimer driven and (c and g) by TIE-GCM driven simulations, (d and h) the latitudinal distribution of the root-mean-square error (RMSE) and the Pearson correlation coefficient of Weimer vs. SDI (solid lines) and AMIE vs. SDI (dashed lines).