The Astrophysical Journal: Rebecca Centeno, Matthias Rempel, Roberto Casini, and Tanausu del Pino Aleman study the effects of finite spectral resolution on the magnetic field values retrieved through the weak field approximation (WFA) from the cores of the Mg II h&k lines. The retrieval of the line-of-sight (LOS) component of the magnetic field, Blos, from synthetic spectra generated in a uniformly magnetized FAL-C atmosphere are accurate when restricted to the inner lobes of Stokes V. As we degrade the spectral resolution, partial redistribution (PRD) effects that more prominently affect the outer lobes of Stokes V, are brought into the line core through spectral smearing, degrading the accuracy of the WFA and resulting in an inference bias, which is more pronounced the poorer the resolution. When applied to a diverse set of spectra emerging from a sunspot simulation, we find a good accuracy in the retrieved Blos when comparing it to the model value at the height where the optical depth in the line core is unity. The accuracy is preserved up to field strengths of B~1700 G. Limited spectral resolution results in a bias toward weaker retrieved fields. The WFA for the transverse component of the magnetic field is also evaluated. We find the best estimates when the WFA is evaluated in the core of the line. Reduced spectral resolution degrades the accuracy of the inferences because spectral mixing results in the line effectively probing deeper layers of the atmosphere.
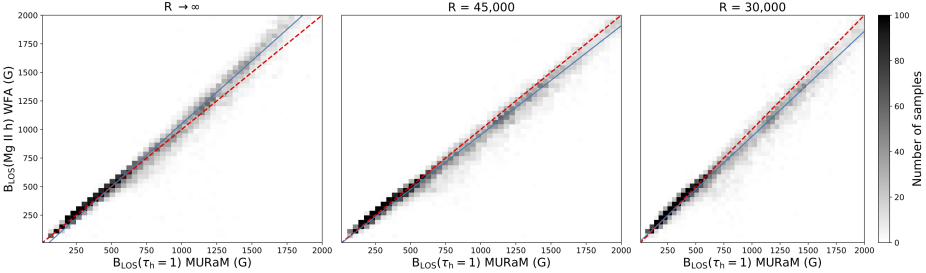
Scatter density plots of the retrieved value of Blos retrieved from Mg II h using the weak field approximation, against their MURaM model counterparts for the case of infinite spectral resolution (left), R = 45,000h (middle) and R = 30,000 (right). The model values are taken at the height where the core of the Mg II h line reaches optical depth unity. The darker the grey-level, the higher the number of samples in the bin. The bin size is 40 G. The red line represents the ideal solution and the blue line shows a linear fit through the data.