Author: R. Casini
Aims: To derive convenient analytic estimations of magnetic inference errors, which can be used to inform and facilitate the creation of the science-traceability matrix of a polarimetric instrument.
Methods: We study the general problem of the propagation of Poissonian noise in polarized light signals to derived data products of the Stokes profiles, namely integral moments of arbitrary orders and spectral derivatives of the intensity. In particular, we derive the errors on the longitudinal and transversal projections of the magnetic field inferred from the weak-field approximation (WFA) of the Zeeman effect.
Results. The propagated errors on magnetic inference are traced back to the signal-to-noise ratio (SNR) of the observations. The results can be used to quantify the contributions of different environmental and instrumental conditions (spectral line width, spectral resolution, line spread function, stray light) to the overall error on the inferred quantities. Our tests indicate that the integral-moment method of inference is comparable to the local derivative in a predictable way.
Preprint at arxiv.org.
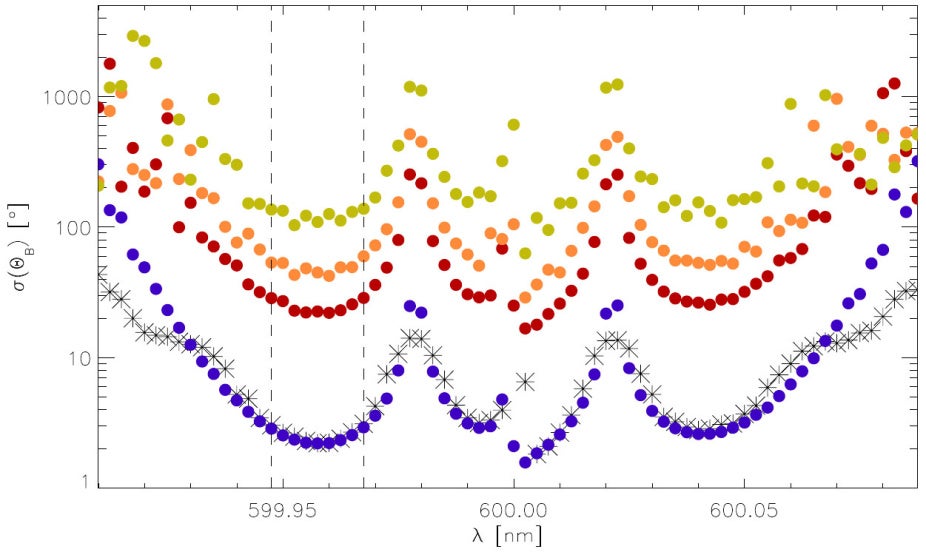
Plot of the error σ(ΘB ) of Eq. (46) as a function of wavelength across a spectral line (dot symbols), for a 1000 G fieldinclined by ΘB = 60◦. For this model, we assumed a spectral resolving power R ≈ 120000 and SNR of 10000 (blue dots), 1000 (red dots), 500 (orange dots), and 200 (green dots) at line center.
For the SNR ∼ 10000 case, the star symbols represent the true standard deviation of ΘB derived through Eq. (29), computedmover 1000 random realizations of the Poissonian noise of the signals used for the calculation of β and γ via Eqs. (37) and (38). We note the almost perfect overlap of the true and estimated errors as a function of wavelength in the high SNR regime. The vertical dashed lines identify the spectral range in the wings of the line where the error estimation is minimum.