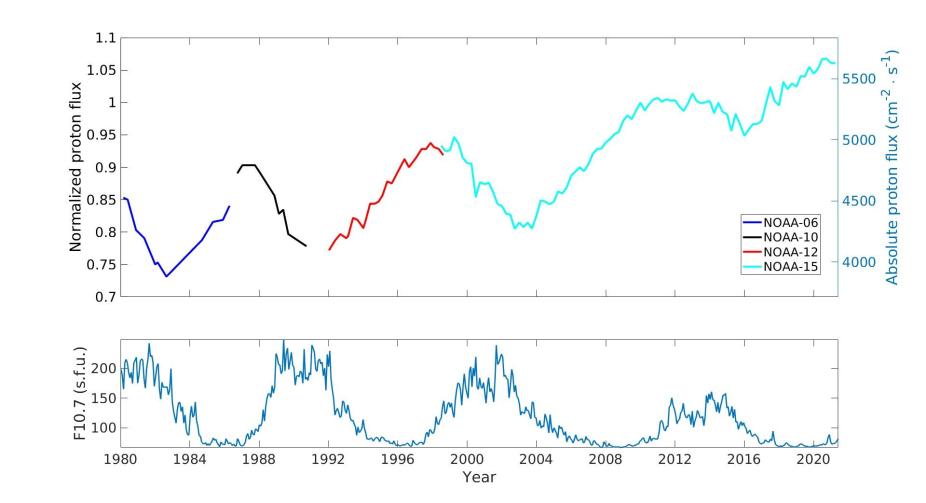
Figure 1. 3-month averaged peak flux for >70 MeV protons in the SAA is normalized to flux (= 1) at the beginning of 2010 (top) and plotted against 10.7cm solar flux (F10.7, bottom) from 1980 to June, 2021 to extend Figure 3 in Qin et al. (JGR, 2014) which covered 1980 through 2009. Different colors are used to represent different POES satellites. Prior to the NOAA-15 data beginning in 1999, satellites measured >80 MeV proton flux. Qin et al. (JGR, g2014) found good agreement between the >80 MeV and >70 MeV proton flux data and determined that no correction factor was necessary. (F10.7 flux in s.f.u. = 10-22W m-2 Hz -1)
The inner zone proton radiation belt consisting of 10’s to >100 MeV protons trapped in the Earth’s magnetic field is examined from 1980 to mid-2021 using measurements from four NOAA POES satellites. A long-term increase in measured proton flux over four ~11 year cycles of solar activity is found. This increase correlates with the current one hundred year minimum in solar activity known as the Gleissberg cycle. Inner zone proton flux is correlated with decreasing solar irradiance maxima at a wavelength of 10.7 cm, serving as a proxy for Extreme Ultra Violet input to Earth’s atmosphere. It is found that current peak proton flux, occurring at a longitude and latitude where the Earth’s magnetic field is weaker, is at the highest levels seen since the begining of observations in 1980. A model calculation of the inner zone proton flux is found to generally confirm the long-term trend. We conclude that this trend observed over ~ 40 years accompanies an average decrease in solar EUV in comparison with previous solar maxima when EUV irradiation was higher as parametrized by F10.7. The reduced EUV at solar maximum reduces proton loss to the atmosphere, thus explaining the observed long-term increase in inner zone proton flux. Space Weather.