Journal of Geophysical Research—N. Koushik, J. Oberheide, N. M. Pedatella
Previous studies have demonstrated that the diurnal variability of water vapor in the mesosphere involves a non-linear interplay between dynamics, photochemistry, and catalytic processes. The inherent difficulty in measurement of winds and water vapor in this region makes the study of mesospheric water vapor complex. Here we study the sources of diurnal variability of water vapor in the mesosphere with the help of the specified dynamics configuration of the Whole Atmosphere Community Climate Model with thermosphere-ionosphere eXtension (SD-WACCM-X) for typical equinox conditions during the solar minimum year 2009. Special emphasis is given to the advective transport by the migrating diurnal tide and its impact on the mean water vapor in the mesosphere. To isolate the contribution from advective and non-advective processes, a Lagrangian parcel trajectory model is employed. Our results indicate that the vertical tidal advection dominates the transport of water vapor in the upper mesosphere and that there is a significant contribution from horizontal tidal advection below 70km. Among non-advective processes, chemical loss of water vapor has the largest contribution. This proof-of-concept is further extended using the recently released version 2.07 of water vapor observations from the Sounding of the Atmosphere using Broadband Emission Radiometry (SABER) instrument and dynamical tides from the empirical Climatological Tidal Model for the Thermosphere (CTMT). Differences in SD-WACCM-X and CTMT+SABER results above 90km are discussed in light of the veracity of SABER water vapor measurements.
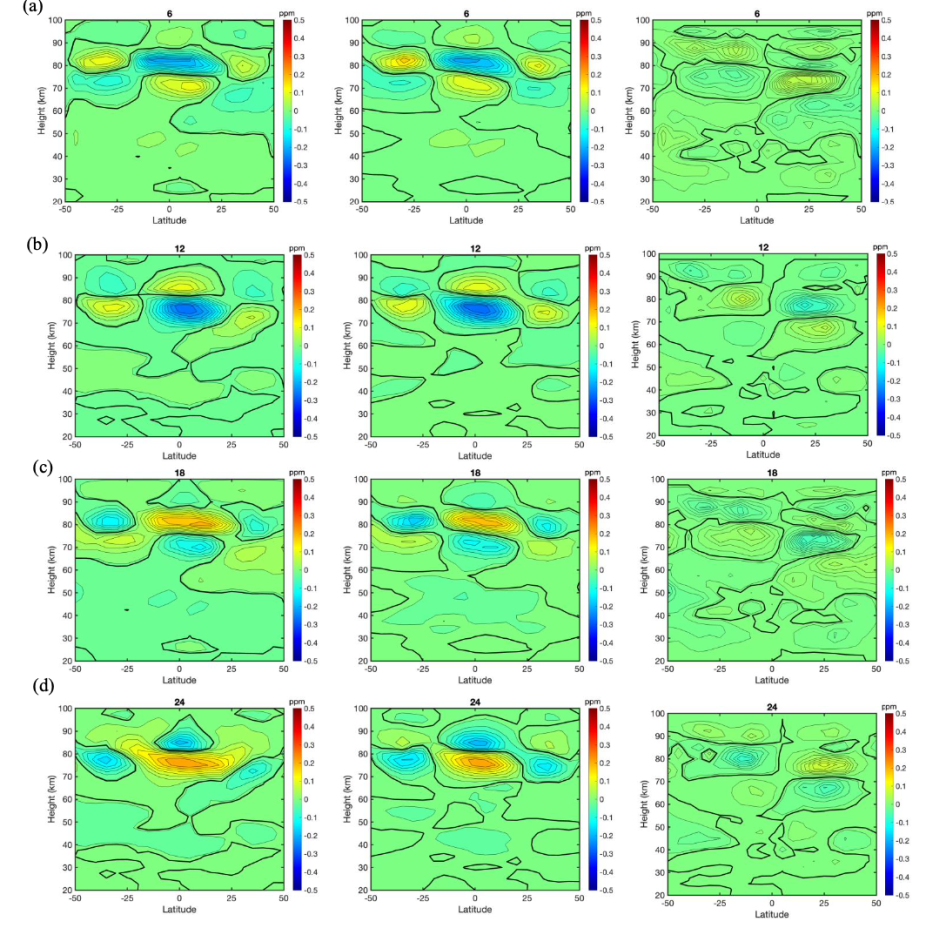
DW1 advected H2O volume mixing ratio (q′adv) for (a) 6h, (b) 12h, (c) 18h and (d) 24h local time on 15 March 2009 for (left) total advection (middle) vertical advection alone and (right) horizontal advection alone. Contour intervals are chosen such that there are 15 contours between the maximum and minimum values in each plot.