We undertake a five solar-cycle (SC 19 - 23) ≈55-year (December 1954 to August 2009) study of the high latitude polarity inversion lines (PILs) using the recently digitized McIntosh Archive (McA) of solar synoptic (Carrington) maps. We looked at the evolution of the median solar latitudes of primary and secondary PILs, and of the polar coronal hole (CH) boundary for all 732 Carrington Rotations (CRs). We found hemispheric differences in the "Rush to the Poles" (RttP) where the polar CH gaps are often longer in the southern hemisphere (SH), and the secondary PIL reaches its polemost latitude at the end of its RttP later and more poleward than in the northern hemisphere (NH). The latitude oscillations found after this poleward peak are also stronger and often longer in the SH than in the NH, and exhibit a 22-year variation. The location variations in the CH boundaries and PILs appear to be at least partly associated with similar variations in the magnetic field. We also found equatorward expansions of the polar CHs by ≈50% and equatorward shifts in the PILs that were part of a disturbance that propagated ≈15°/CR from the SH to the NH in the descending phase of SC 23.
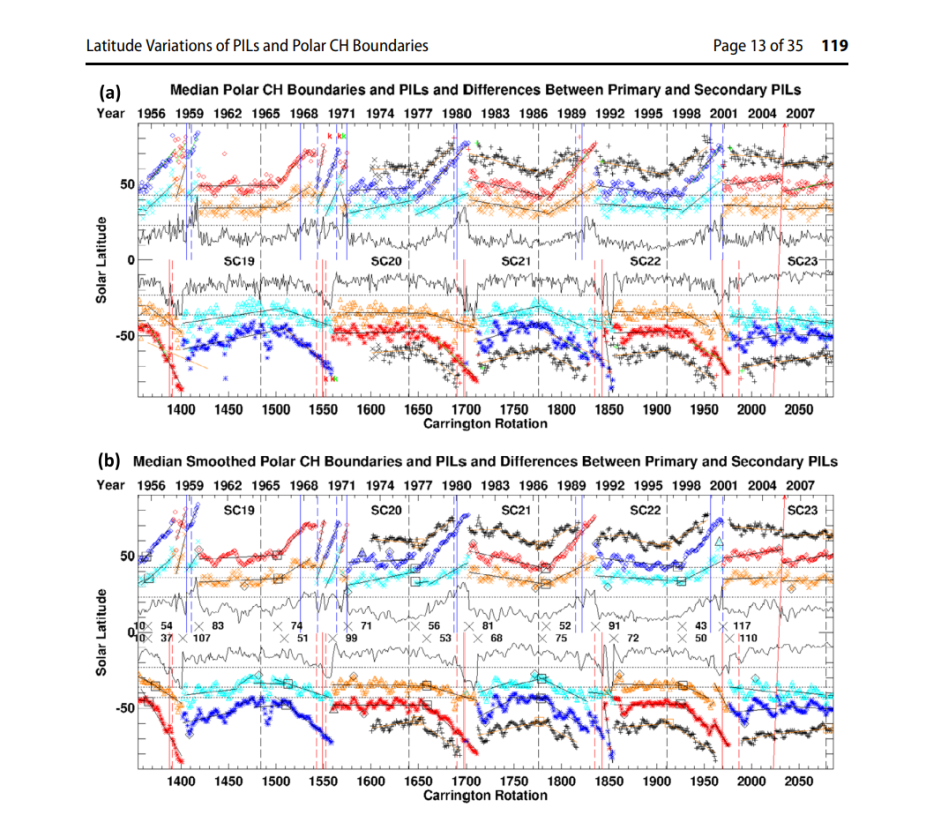
Figure 6 (a): The median primary and secondary PIL locations for each CR synoptic map are plotted as diamonds and x’s for the NH, respectively, and as asterisks and triangles in the SH. Red and orange colors are for negative pole polarities, and blue and cyan are for positive pole polarities. The black +’s are the median locations of the CH boundary found from a CH at the pole to ±43° with fitted orange lines. The red +’s mark the last and the first polar CH on either side of the gap in solar maximum, and green +’s are the first persistent, complete polar CHs, where these are ‘k’s in SC 20 at ±80° since they are estimated from Mk2 images. The black X’s are the 8 CRs using Skylab He-II 304 Å observations of the CHs. The dashed vertical lines are SILSO solar minima in black, and SILSO solar maxima in red for the SH and blue for the NH, while polarity reversals above ±60° are solid lines. Where there are two in a SC, the last is used. PILs are fitted with black lines, or orange to compare with Xu et al. (2018, 2021), and green to compare with Hyder (1965) and Altrock (2003b, 2014). The difference of primary minus secondary PILs are black lines by the equator for the NH and SH, with the median differences in the non-rush periods as dashed lines. The dotted lines at ±43°, ±36° and ±23° indicate the equatorward limits of the CH boundary, primary and secondary PILs. The red arrow from CR2023 – 35 shows the 15°/CR progression of a disturbance from the SH to the NH. (b): The same as (a) except the median locations have 3-CR smoothing and anomalous points are revised. The minimum secondary and maximum primary latitudes in the non-rush periods are marked with diamonds, where triangles mark the RttP ends of the secondary PILs if they are not the diamonds. Black squares mark the intersection of the lines used to find the beginning CR of the RttP for PILs (marked as X’s near the equator with the CR lengths of the periods) and orange squares for CH boundaries.