The Astrophysical Joural: Solar active regions (ARs) do not appear randomly but cluster along longitudinally warped toroidal bands (‘toroids’) that encode information about magnetic structures in the tachocline, where globalscale organization likely originates. Global MagnetoHydroDynamic Shallow-Water Tachocline (MHDSWT) models have shown potential to simulate such toroids, matching observations qualitatively. For week-scale early prediction of flare-producing AR emergence, forward-integration of these toroids is necessary. This requires model initialization with a dynamically self-consistent MHD state-vector that includes magnetic, flow fields, and shell-thickness variations. However, synoptic magnetograms provide only geometric shape of toroids, not the state-vector needed to initialize MHD-SWT models. To address this challenging task, we develop PINNBARDS, a novel Physics-Informed Neural Network (PINN)-Based AR Distribution Simulator, that uses observational toroids and MHD-SWT equations to derive initial state-vector. Using Feb-14-2024 SDO/HMI synoptic map, we show that PINN converges to physically consistent, predominantly antisymmetric toroids, matching observed ones. Although surface data provides north and south toroids’ central latitudes, and their latitudinal widths, they cannot determine tachocline field strengths, connected to AR emergence. We explore here solutions across a broad parameter range, finding hydrodynamically-dominated structures for weak fields (∼2 kG) and overly rigid behavior for strong fields (∼100 kG). We obtain best agreement with observations for 20–30 kG toroidal fields, and ∼ 10◦ bandwidth, consistent with low-order longitudinal mode excitation. To our knowledge, this framework provides the first plausible method for reconstructing state-vectors for hidden tachocline magnetic structures from surface patterns; this could potentially lead to accurate prediction of flare-producing AR-emergence weeks ahead.
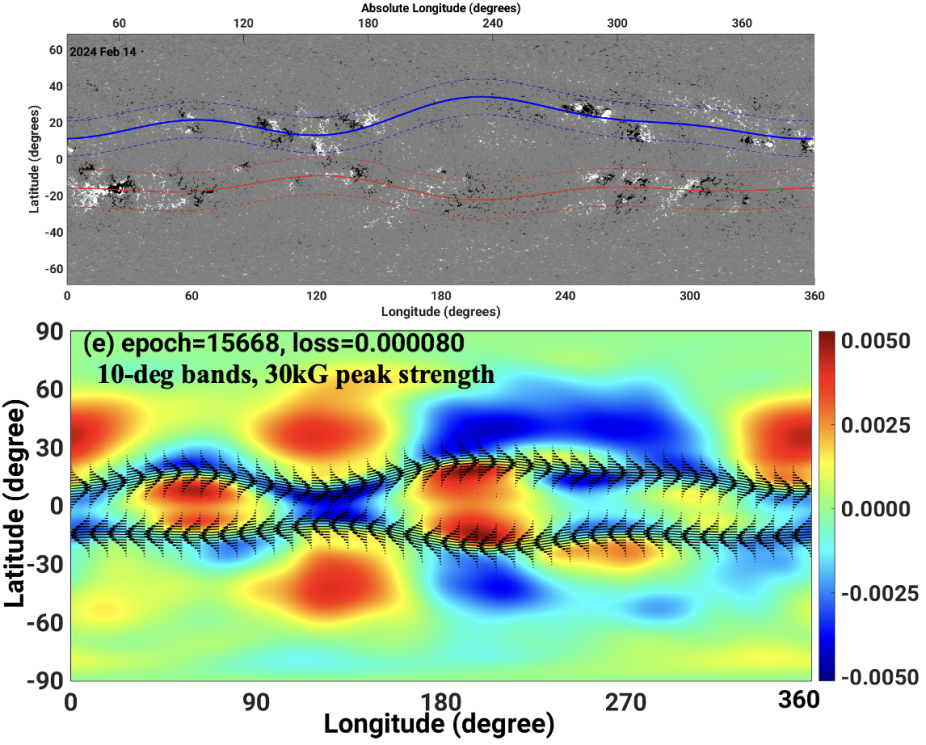
Top: Two warped toroid patterns (derived from SDO/HMI magnetograms) displayed in North and South hemispheres for February 14, 2024, one week before the big storm from AR13590. Solid blue (red) curves respectively denote the central latitudes, and dashed curves on both sides of solid blue (red) curve imply the width of the North (South) toroidal bands in which ARs are strung.
Bottom: PINN-simulated MHD-tachocline-model solutions of magnetic vectors (black-arrows, overlaid on tachocline bulging (red) /depressions (blue) in rainbow map) to replicate the observed warped toroidal magnetic bands of February 14, 2024.