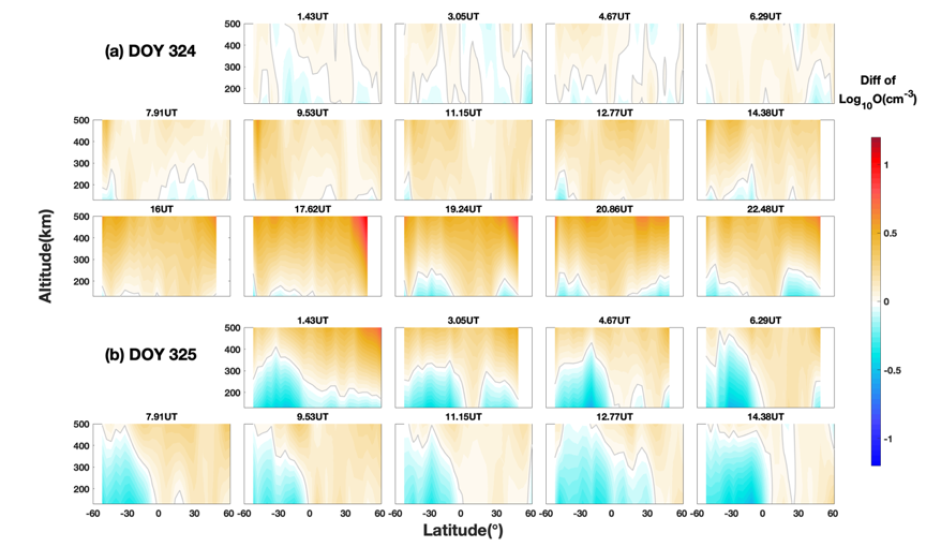
Altitudinal and latitudinal images of O perturbations (storm-quite) along 14 GUVI limb tracks on DOY 324 and the first 9 tracks on DOY 325. The local solar time at the equator was ~13.5 h, and the corresponding UTs are as labeled. In each panel the gray curve indicates the zero value.
Tingting Yu, Wenbin Wang, Zhipeng Ren, and Jia Yue use TIMED/GUVI limb measurements of FUV airglow emission to investigate thermospheric composition and temperature responses to the 20-21 November 2003 (day of year (DOY) 324 and 325) superstorm. Altitude profiles of O, N2 number densities and temperature on the storm days along the GUVI limb tracks are compared with those on DOY 323 (quiet time). The storm-time composition and temperature responses were global and evolved continuously as the storm progressed. N2 and temperature increased globally at all altitudes during the storm with similar perturbation structures. The magnitudes of their enhancements both increased with altitude and latitude. The storm-induced O perturbations decreased in the lower thermosphere but increased in the upper thermosphere. Transition heights of O perturbations from decrease to increase changed with latitude and time. There was large hemispheric asymmetry in O and N2 responses as they have different morphologies and lifetime, especially in the storm recovery phase.