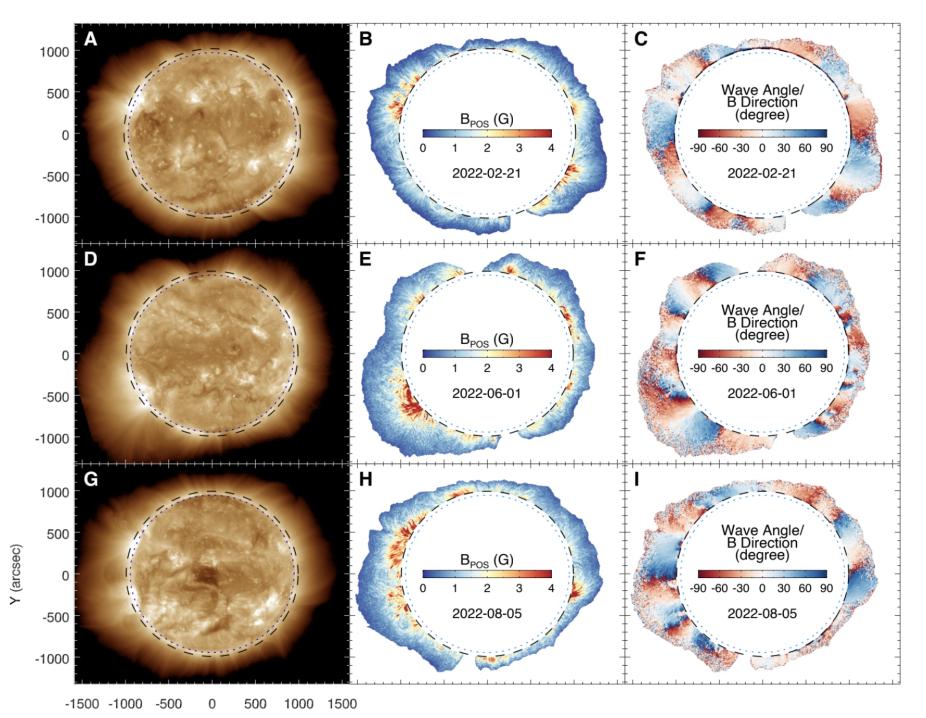
Science: The energy powering the hot solar corona and driving solar eruptions lies in the coronal magnetic field. Monitoring the field evolution in the global corona is crucial but has not been achieved before. With daily observations from the Upgraded Coronal Multi-channel Polarimeter, we have obtained magnetograms of the global corona above the solar limb over approximately eight months. We have obtained magnetic field distributions on spherical shells with different solar radii in the corona, and monitored evolution of the field at nearly all latitudes and across different heights throughout multiple solar rotations. A comparison of observational results with coronal models reveals general consistency yet distinct discrepancies particularly in high-latitude regions, suggesting the potential of model improvement through constraints from these observations.

Examples of global coronal magnetic field maps and simultaneously taken coronal intensity images. (A) Composite GOES/SUVI 19.5 nm intensity image generated using observations from 19:48 UT to 19:52 UT on 21 February 2022. (B and C) UCoMP maps of coronal magnetic field strength and direction (POS component) on 21 February 2022. A median filter of 3×3 pixels was applied to reduce noise. (D) Similar to (A) but for observations from 20:48 UT to 20:52 UT on 1 June 2022. (E and F) Similar to (B) and (C) but on 1 June 2022. (G) Similar to (A) but for observations from 19:48 UT to 19:52 UT on 5 August 2022. (H and I) Similar to (B) and (C) but on 5 August 2022. The reference direction in (C), (F) and (I) is the local radial direction. Wave propagation direction that is counterclockwise to the local radial direction is defined as a positive angle and otherwise negative.