Solar Physics: We examine the process during which the solar magnetic field reverses polarity around solar maximum. We use the McIntosh Archive (McA) of solar synoptic maps over five consecutive solar cycles, SCs 19-23 or from 1955 to 2009. This data set permits us to track features such as filaments, polarity inversion lines (PILs), coronal hole (CH) boundaries and sunspots over many consecutive Carrington rotations and solar cycles. The McA allows tracking of the evolution of the polar magnetic regions and how the rush-to-the-pole (RttP) patterns occur during the period when the polar fields reverse around each activity maximum. We use the McA data set to determine the timing and lags among these events around the maximum of each SC in each hemisphere: the sunspot number peak, the polarity reversal, the disappearance of the polar crown filaments and PILs, the poleward movement of mid-latitude CHs of new-cycle polarity behind the primary PIL, the first appearance of polar CHs of new-cycle polarity, and the earliest persistent complete coverage of each pole by a CH. The goal is to use the RttPs and CH boundary mapping to better constrain solar interior and dynamo models. The end of the PIL RttP, the end of the RttP of the poleward boundary of new-cycle polarity mid-latitude CHs, and the first appearance of new-cycle polar CHs are nearly coincident and follow the polarity reversals in each hemisphere by about 1 year. We also show the lag times with regard to “terminator” times, which denote when the toroidal magnetic flux built during a given cycle is cancelled across the equator, thus beginning the rise of new-cycle flux. This occurs after the start of the RttPs of the polar CH boundaries, and near the start of the primary and secondary PIL RttPs. The start of the RttP of the poleward boundary of the new-cycle, mid-latitude CH that lead to the new polar CH always occurs later than the terminator time, so the terminator is located near the beginning of the ascending phase.
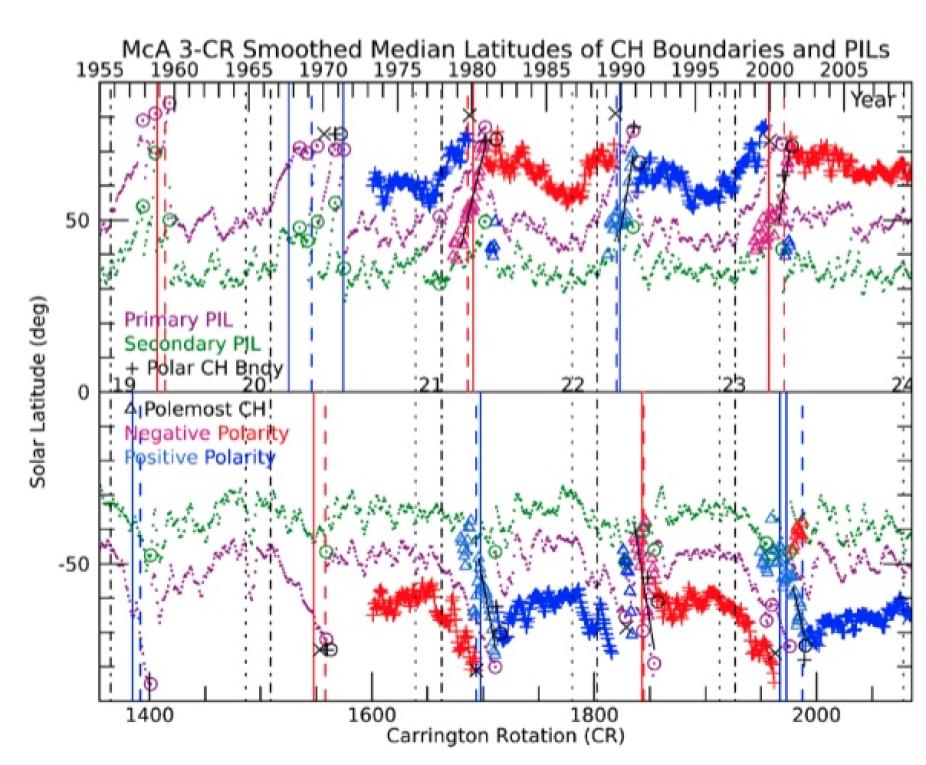
The 3-CR smoothed median primary and secondary PIL locations for each CR synoptic map are plotted as purple and green dots, respectively, where the location of the ending primary PIL after one or more RttPs is circled in purple. The secondary PIL is also circled in green at the end of multiple RttPs and shows where it becomes the primary PIL in purple. The 3-CR smoothed boundaries of the polar CHs are red and blue ‘+’s for negative and positive polarities. Black ‘X’s and ‘+’s are the unsmoothed median latitudes of the last old-cycle polarity polar CH and first appearance of new-cycle polar CHs. The black circles mark the CRs when the polar CHs are “persistently established”. These locations are arbitrarily put at ±75° in SC 20 from non McA polar CH observations to be close to the ending primary PIL locations. The solid vertical lines indicate when the magnetic polarities change in each hemisphere poleward of ±60° to negative (red) or positive (blue). The red and red-violet (negative) and blue and royal blue (positive) triangles show the RttP of the 3-CR smoothed median latitudes of the poleward locations of mid-latitude CHs for maps when polar CHs are missing or partial. The red and blue triangles in-between the primary and secondary PILs after the CH RttP are opposite in polarity to the polar CHs. The blue triangles in the Southern hemisphere in SC22 show a separate RttP of the polward edges of old-cycle, mid-latitude CHs before the RttP of new-cycle, mid-latitude CHs that establishes the polar CH to new-cycle polarity. Fitted slopes (black lines) for the last mid-latitude CH RttPs (red and blue triangles) reveal that they are usually steeper than the last primary PIL RttPs. The 13-month total sunspot solar minima times are the vertical black dotted lines, which are followed by the “terminator” times (McIntosh et al., 2019) as dash-dot black lines. The sunspot solar maxima times are dashed vertical lines using the same red or blue color of the new-cycle polarity.