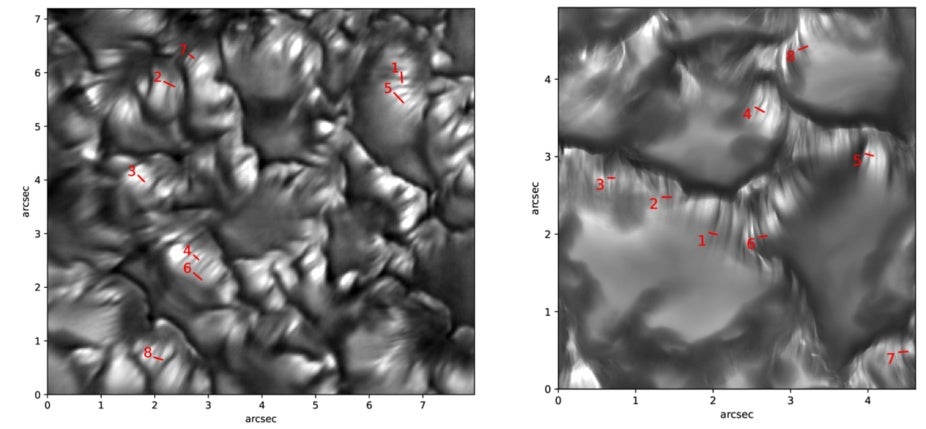
Left: G-band intensity image observed with DKIST VBI showing striations with widths of approximately 20‑50 km. Right: Synthetic G-band intensity image computed from a MURaM simulation for an inclination of μ = 0.85, matching the observed inclination. The numerical simulation shows intensity striations on a comparable scale and confirms their association with photospheric magnetic flux concentrations that modulate the geometrical height where the emergent intensity forms.
The Astrophysical Journal Letters: Striated granular edges observed in the solar photosphere represent one of the smallest-scale phenomena on the Sun. They arise from the interaction of strongly coupled hydrodynamic, magnetic, and radiative properties of the plasma. In particular, modulations in the photospheric magnetic field strength cause variations in density and opacity along the line of sight, leading to their formation. Therefore, the striation patterns can be used as valuable diagnostics for studying the finest-scale structure of the photospheric magnetic field. The Daniel K. Inouye Solar Telescope (DKIST) allows observations of the solar atmosphere with a spatial resolution of better than 0 .″ 03 with its current instrumentation. We analyze images acquired with the Visible Broadband Imager using the G-band channel to investigate the characteristics of fine-scale striations in the photosphere and compare them with state-of-the-art radiation-MHD simulations at similar spatial resolution. Both observed and synthetic images reveal photospheric striae with widths of approximately 20‑50 km, suggesting that at least 4 m class solar telescopes are necessary to resolve this ultrafine structure. Analysis of the numerical simulations confirms that the striation observed in the filtergrams is associated with spatial variations in photospheric magnetic flux concentrations, which cause shifts in the geometrical height where the emergent intensity forms. Some fine-scale striations in the synthetic images originate from magnetic field variations of approximately 100 G, resulting in Wilson depressions as narrow as 10 km. This suggests that DKIST G-band images can trace the footprints of magnetic field variations and Wilson depressions at a similar scale.