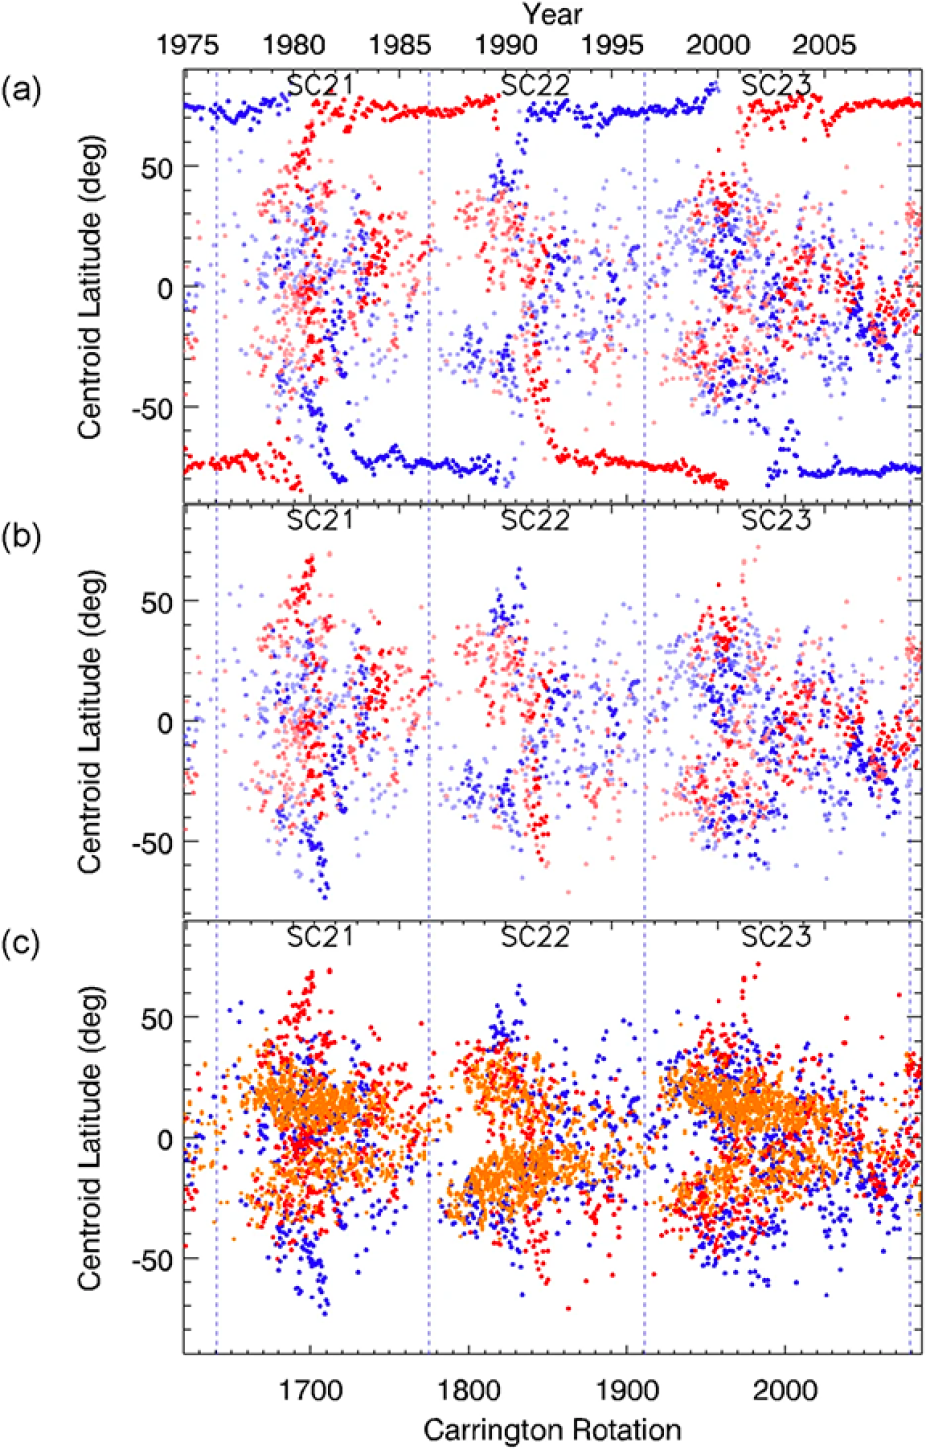
Coronal hole centroid latitude vs. Carrington Rotation (bottom) and year (top) for almost three solar cycles (SC21-23). Red represents negative polarity and blue represents positive polarity, with the darker shades representing longer lifetimes, i.e., the number of rotations a given coronal hole or grouping of coronal holes recurs (assuming a rigid 27.3 day rotation rate). Note that coronal holes that last for more than one rotation are plotted for each rotation at the location of their centroid position for that rotation. The 11-year magnetic polarity change at the poles as seen with coronal holes is clear as is the slight asymmetry of the evolution of coronal holes at each pole – i.e., the new polarity coronal hole appears at the north poleslightly before the south pole. The beginning of the solar cycles are marked with a vertical dashed line and based on Sunspot Index and Long-term Solar Observations (SILSO) sunspot numbers.
Version 2; SILSO data available from Royal Observatory of Belgium, Brussels
Ian Hewins, Sarah Gibson, David Webb, Bob McFadden, Thomas Kuchar, and Barbara Emery-Geiger
Using the McIntosh Archive of solar features, we analyze the evolution of coronal holes over more than three solar cycles. We demonstrate that coronal hole positions and lifetimes change dramatically on time scales from months to yrs, and that the pattern of these changes is clearly linked to the solar activity cycle. We demonstrate that the lifetimes of low-latitude coronal holes are usually less than one rotation but may extend to as long as three years. When plotted over time, the positions of low latitude coronal holes that remain visible for over one rotation track the sunspot butterfly diagram in terms of their positions on the sun over a solar cycle. Finally, we confirm that coronal holes do not in general rigidly rotate.