Astronomy and Astrophysics–J. Zhao, P. Zhang, S. E. Gibson, Y. Fan, L. Feng, F. Yu, H. Li, and W. Q. Gan
Context—Strong ultraviolet (UV) emission from the sun will be observed by the Lyman-α Solar Telescope (LST; Li et al. 2019) on board the Advanced Space-based Solar Observatory (ASO-S; Gan et al. 2019) which is scheduled for launch in 2022. It will provide continuous observations from the solar disk to the corona below 2.5 solar radius with high resolution. To configure appropriate observing modes and also to better understand observations in future, simulations and syntheses of different structures as well as different processes need to be done in advance. Aims. As prominence eruptions are main drivers of space weather, the need to monitor such phenomena has priority among the objectives of ASO-S mission. In this work, we synthesize the evolution of the prominence-cavity system before and during its eruption in the field-of-view (FOV) of LST.
Methods—The input MHD model is adopted from Fan & Liu (2019), which compares to the AIA observations quite well. The Lyman-α emission of the prominence and its eruptive counterparts are synthesized through the PRODOP code which considers NLTE radiative transfer processes, while the other coronal parts, e.g., the cavity and surrounding streamer, are synthesized with the FORWARD package that deals with optically-thin structures.
Results—We present a discussion of the evolution of the eruptive prominence-cavity system, analyzing the synthetic emissions both on the disk near the limb and in the corona as viewed by the coronagraph, as well as the three-dimensional data of MHD simulations.
(published version)
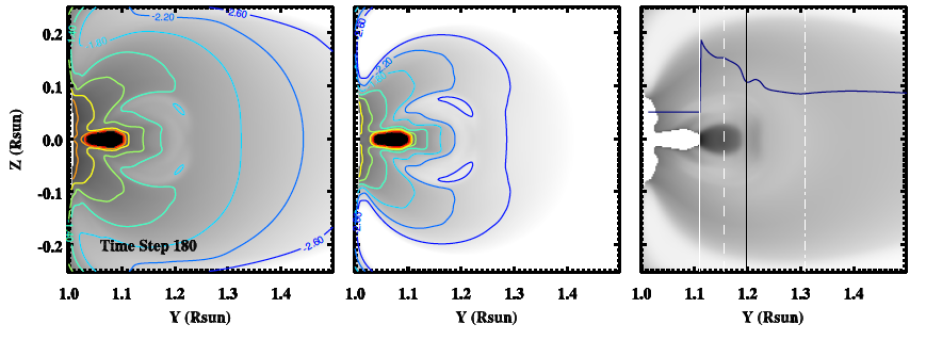
Synthesized results of Lyman-α emission based on Fan & Liu (2019) MHD prominence cavity simulation, shown for a slice centered on the plane-of-sky. The radiative component, the collisional component and ratio of the two components are shown from left to right. In the first two columns, contours are overlaid on the intensity maps to emphasize the structures. The horizontal line curves embedded in the figures in the third column shows evolutions of the ratio along the limb at Z=0. The vertical solid lines in black and white indicate the bottom and top of the central cavity, while the dashed line passes through the cavity. The dash-dotted line marks a location above the cavity and in the streamer.