The Astrophysical Journal: We test the use of the Mg II resonant lines for measurement of the magnetic field at the top of the chromosphere of polar coronal holes (CHs). The Hanle effect in the core of Mg II k enables access to a regime of field strengths where the Zeeman effect has little diagnostic value (especially at the solar poles, where most of the field is transverse to the line of sight). Synthetic Stokes spectra computed from a radiation magnetohydrodynamic simulation of a CH emulating a high viewing angle are inverted with the HanleRT Tenerife Inversion Code, which accounts for the physical processes that lead to scattering-induced polarization and its modification due to the magnetic field and other symmetry-breaking mechanisms. We find that, while degeneracies in the atmospheric model lead to poor inferences of the thermodynamical properties, the magnetic inferences are highly consistent with the model values. The mean magnetic field strength in the simulation cube is typically retrieved with a relative error of δB ∼ 20% and an absolute error of ΔB ∼ 2 G at the top of the chromosphere. This opens up an avenue for promising chromospheric constraints for magnetic extrapolation models that ingest photospheric magnetograms, whose biases and uncertainties are troublesome to the reconstruction of the heliospheric magnetic field.
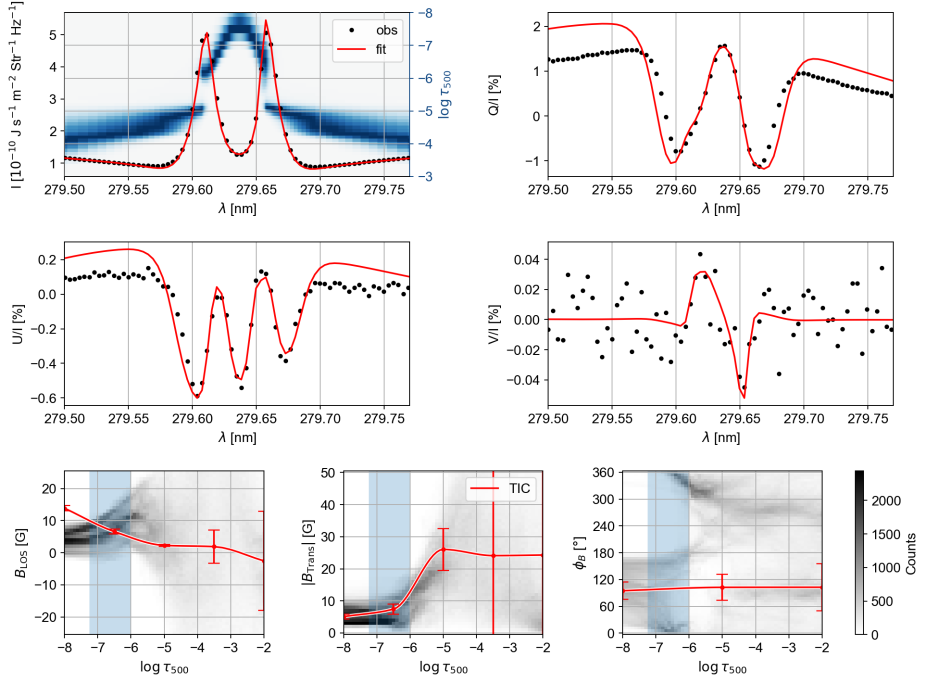
Inversion of an average synthetic Mg II k spectrum averaged over a 5"x5" area of a quiet Sun coronal hole simulation. The inversion strategy optimizes the fit of the spectral line core to extract the magnetic information at the top of the chromosphere. The synthetic observations are represented by black dots and the best-fit spectrum achieved by the HanleRT-TIC inversion is shown with red lines in the top four panels; additionally, the top-left panel shows the contribution function of the spectral line in blue. The bottom row shows the retrieved magnetic field stratification (red line) and the formal error bars at the inversion nodes derived by HanleRT-TIC. The inversion results are compared to the ensemble of values from the MURaM model atmospheres (gray histogram) used to create the synthetic observation. The height range of formation of the line core is indicated by the vertical blue stripes. The inversion inferences of the magnetic field are compatible with the average values of the simulation within the blue stripes.