Hinode/SP
The spectro-polarimeter (SP) on board the Hinode satellite (Japan/US/UK) carries out precise high resolution spectro-polarimetric observations of the Sun’s Photosphere from space. It is the first instrument of its kind to be put in orbit and operate in a seeing-free environment. Hinode was launched in 2006 and its three telescopes have been observing the Sun ever since.
SP is a slit-spectrograph instrument that measures the four Stokes parameters of the Fe I 630.1-630.2 nm line pair. Although these measurements had been routinely done from the ground, the high spatial resolution and the consistent data quality of Hinode/SP have provided a wealth of information of the nature of photosphere magnetic fields like never before.
SP can cover a field-of-view of up to 150”x300”, with a spatial sampling of ∼ 0.15 ″. It measures the Stokes vector in the Fe I line pair at 630.1 and 630.2 nm with a 21.5 mÅ spectral sampling and a polarization noise of 10-3 times the continuum intensity. SP can operate in different modes, allowing anything from sit-and-stare observations, to fast scans of a region of interest, to large field-of-view deep integrations at full spatial resolution. This flexibility has enabled SP to address many different scientific questions.
For further technical information about SP see Lites et al. 2013.
Data products — Level 1 and Level 2 SP data products are available through CSAC under the data link.
Level 1 data correspond to the calibrated Stokes profiles of the Fe I 630.1 and 630.2 nm lines. Each SP dataset consists of a sequence of FITS files, one per scanning step. For every scanning step, SP produces four images: one for each Stokes parameter as a function of wavelength and spatial position along the slit. A 2-dimensional SP image can be reconstructed from the raster of slit positions, as shown by the image below.
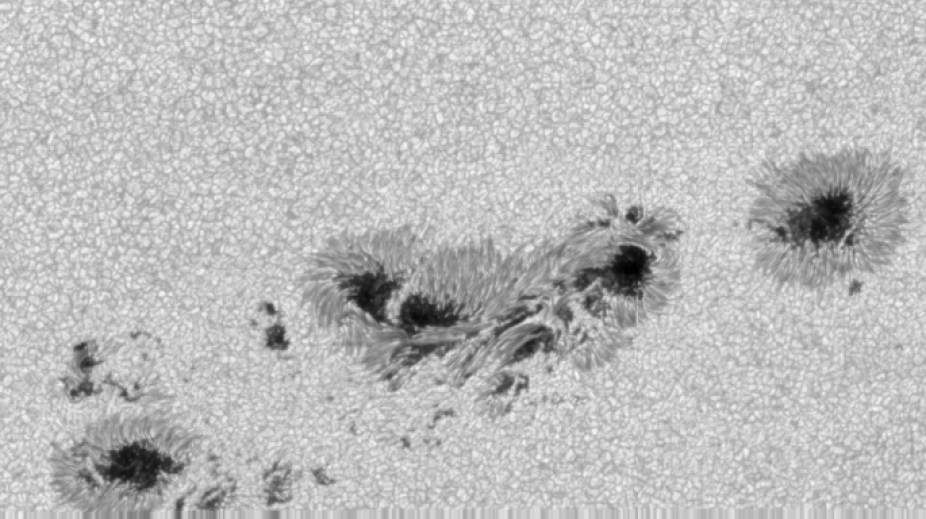
Reconstructed continuum intensity scan of an active region.
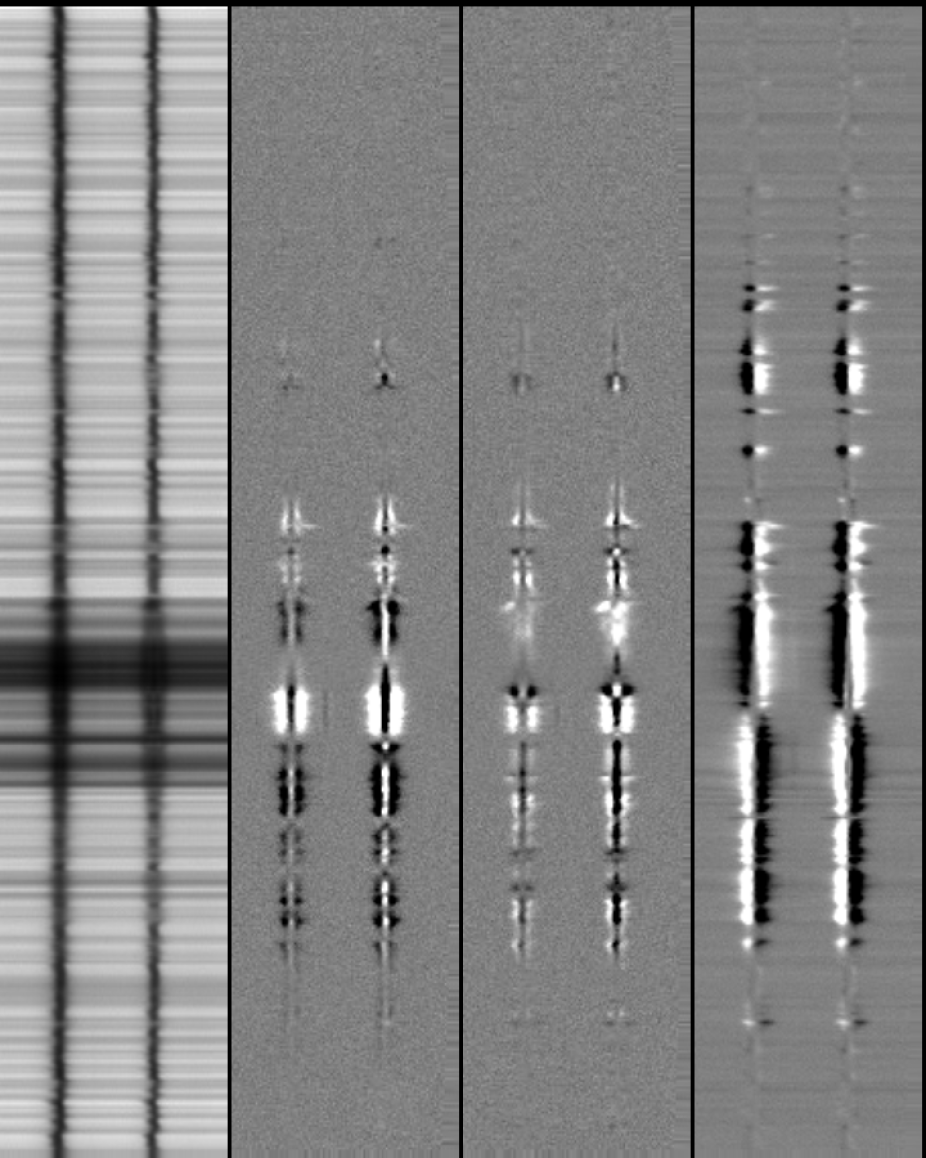
Stokes profiles (from left to right: I, Q, U, V) for one slit position (vertical cut of the previous image) as a function of wavelength and spatial position along the slit.
Level 2 data are the results of a Milne-Eddington inversion of the Stokes profiles. SP data are routinely inverted using the MERLIN code in order to produce the best estimate of a number of physical quantities, such as the magnetic field strength and its orientation, the Doppler velocity and the magnetic filling factor.
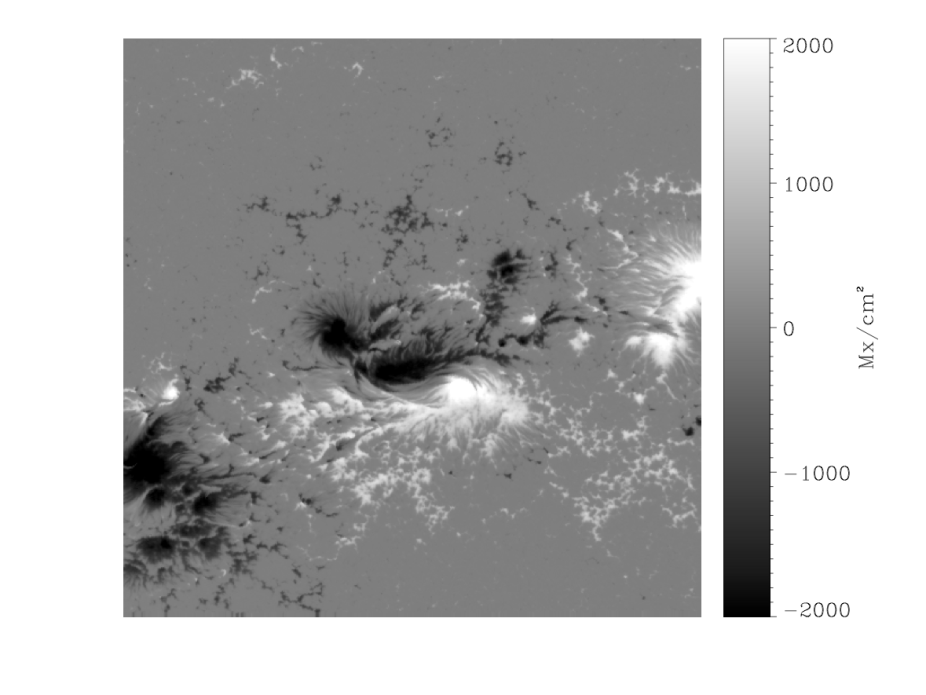
Magnetic flux density obtained from the MERLIN inversion of an SP map of an active region.
For a more detailed description of the Hinode/SP data products go here.