Publication: Philosophical Transactions of the Royal Society; Authors: B. Fleck; M. Carlsson; E. Khomenko; M. Rempel; O. Steiner; G. Vigeesh
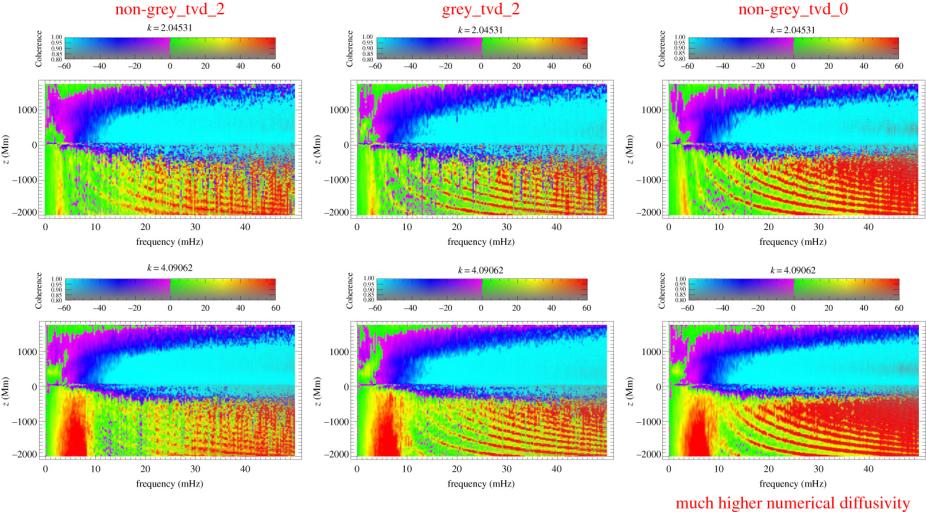
ν − z phase diagrams (cuts at constant horizontal wavenumber at approx. 2 and 4 Mm−1 through the stacks of the layer-by-layer two-dimensional k − ω phase difference diagrams) for various MURaM models. There is a dramatic difference between the subphotospheric layers (the convection zone) and the solar atmosphere above z = 0 km (τ5000 = 1) layer. In the atmosphere (z > 0 km), we see in large parts the expected behaviour: green and red areas at the lowest frequencies in the gravity wave regime, followed by a transition into propagating acoustic waves with increasingly negative phase differences (purple and blue regions).
There has been tremendous progress in the degree of realism of three-dimensional radiation magneto-hydrodynamic simulations of the solar atmosphere in the past decades. Four of the most frequently used numerical codes are Bifrost, CO5BOLD, MANCHA3D and MURaM. Here we test and compare the wave propagation characteristics in model runs from these four codes by measuring the dispersion relation of acoustic-gravity waves at various heights. We find considerable differences between the various models. The height dependence of wave power, in particular of high-frequency waves, varies by up to two orders of magnitude between the models, and the phase difference spectra of several models show unexpected features, including ±180° phase jumps.
This article is part of the Theo Murphy meeting issue 'High-resolution wave dynamics in the lower solar atmosphere'.