Understanding how climate may change under different solar conditions is both interesting and important. However it is difficult to clearly identify solar signal from the very large climate variability on broad time scales. In this study, we tackle this problem by providing a lower bound of the solar minimum condition according to our current understanding of solar physics. By specifying this extremely low solar minimum condition in a climate model that takes into consideration of the effects of ocean and middle atmosphere, we are able to identify significant climate responses, which are very different between the northern and southern hemispheres. We gain an understanding of the processes driving these responses, including how the lower and upper atmospheric processes may enhance/offset each other. By comparing these climate responses to those under nominal solar minimum conditions, we expose climate patterns that are hidden under the large climate variability in the latter.

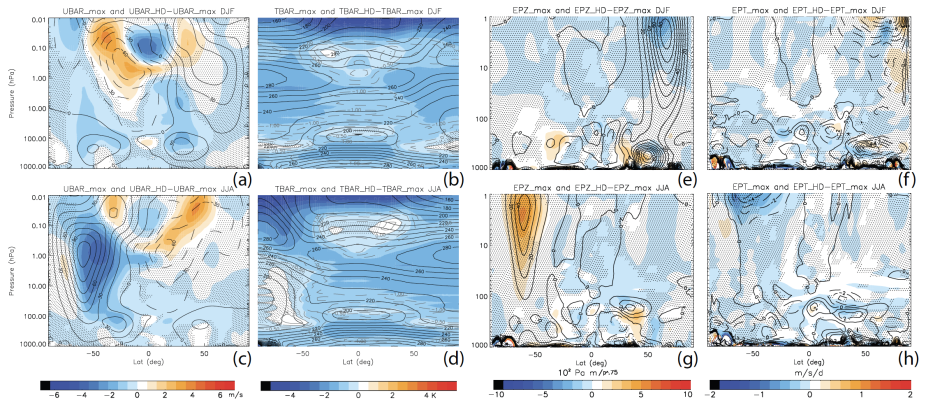
Differences of average zonal mean zonal wind (color contours) between 50--200 year of HD and Smax simulations for (a) DJF and (c) JJA. Line contours are average zonal mean zonal wind from Smax simulations (contour intervals: 15 m/s. (b) and (d): similar to (a) and (c) but for average zonal mean temperature differences (color contour and grey line contours for differences less than 1 K, with 0.25 K intervals). Line contours are average zonal mean temperature from Smax simulations (contour intervals: 10 K). (e) and (g): similar to (a) and (c) but for average vertical EP flux component differences. The EP flux (unit: Pa m) is normalized by p^0.75 (p: atmosphere pressure) to better visualize the change at all altitudes (color contour). Line contours are average normalized vertical EP flux component from Smax simulations (contour intervals: 10x10^2). (f) and (h): similar to (a) and (c) but for average EP flux divergence differences (color contour). Line contours are average EP flux divergence from Smax simulations (contour intervals: 1 m/s/d).}