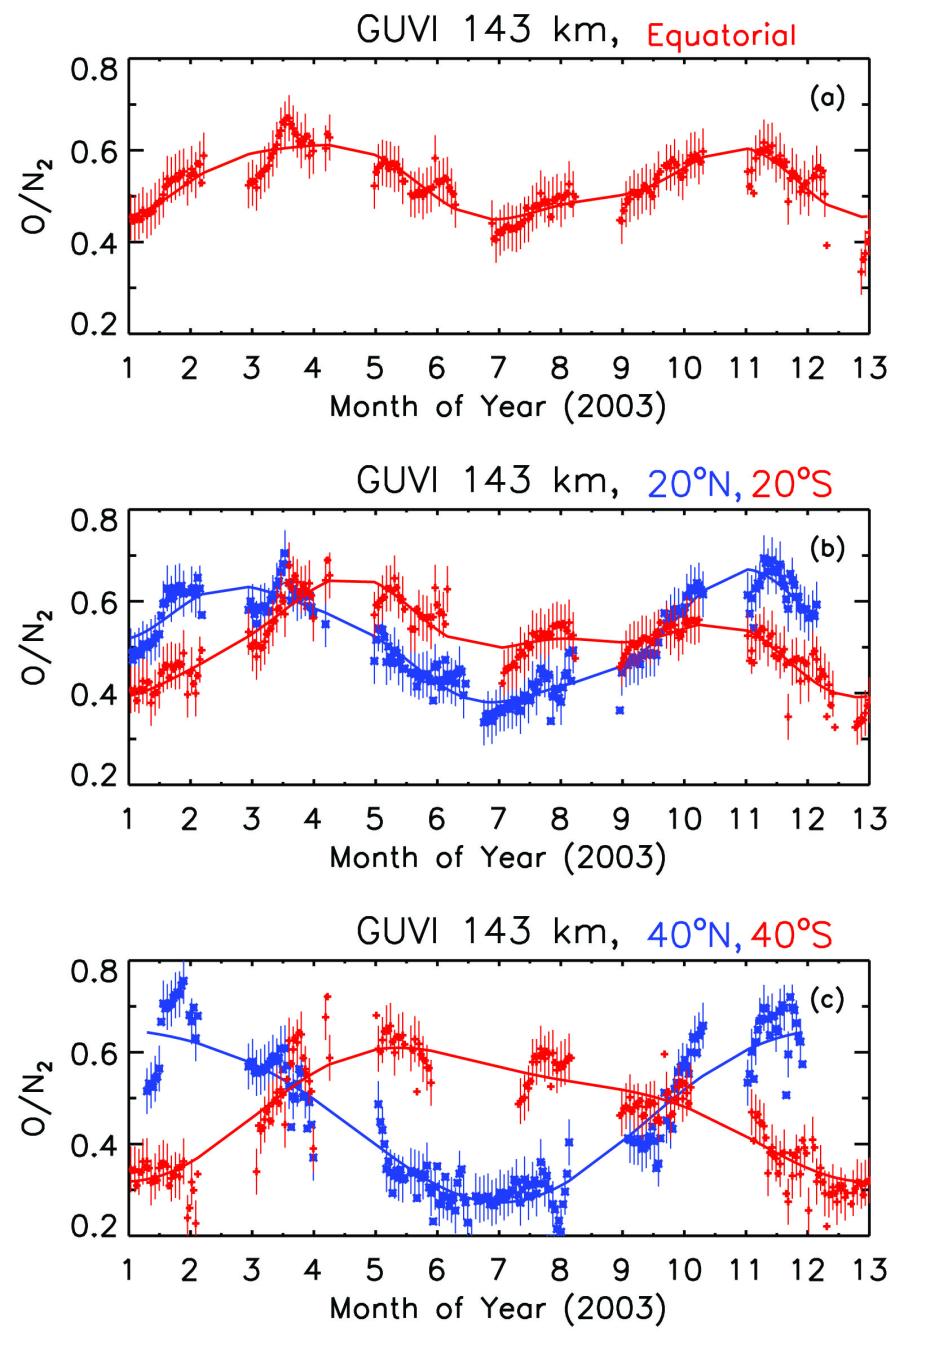
Daily average O/N2 at 143 km derived from GUVI limb observations for 2003, for the latitude bins of (a) the equatorial (10oS – 10oN); (b) 20oS (10oS – 30oS, red) and 20oN (10oN – 30oN, blue); (c) 40oS (30oS – 50oS, red) and 40oN (30oN – 50oN, blue). The vertical bars show one standard deviations. The solid lines are the corresponding Fourier harmonic fittings (annual and semiannual) to the data.
We examine hemispheric asymmetry of the annual and semiannual variation of the ratio of O and N2 concentrations (O/N2) using observations by the GUVI instrument onboard the TIMED satellite and compare them with WACCM-X model simulations. We found that in the equatorial region, the “equinox peaks” of the observed O/N2 are near the end of March and October, and the two annual lows are near the beginning of July and January. Compared to the equatorial region, in the northern hemisphere (NH) low latitudes, the first “equinox peak” clearly shifts toward the December solstice (DS), whereas in the southern hemisphere (SH) low latitudes, the “equinox peaks” shift toward the June solstice (JS), forming the hemispheric asymmetry characteristics of the annual and semiannual variation. Seasonal variation of O/N2 shows no apparent phase variation with altitude, and the annual and semiannual pattern is consistent from year to year. WACCM-X reproduces the observed annual and semiannual pattern in NH but in SH, it simulates an annual variation instead of the observed annual and semiannual variation. The largest discrepancy occurs near JS in the lower and middle thermosphere: the simulated O density has an annual high near JS in SH; the simulated N2 density has an annual high near JS in NH but a predominant annual low near JS in SH. These are not in the GUVI data. A weaker thermospheric meridional circulation in the winter hemisphere, or a reduced summer-to-winter latitudinal gradient of neutral temperature in WACCM-X simulations would make model-data comparisons more consistent.