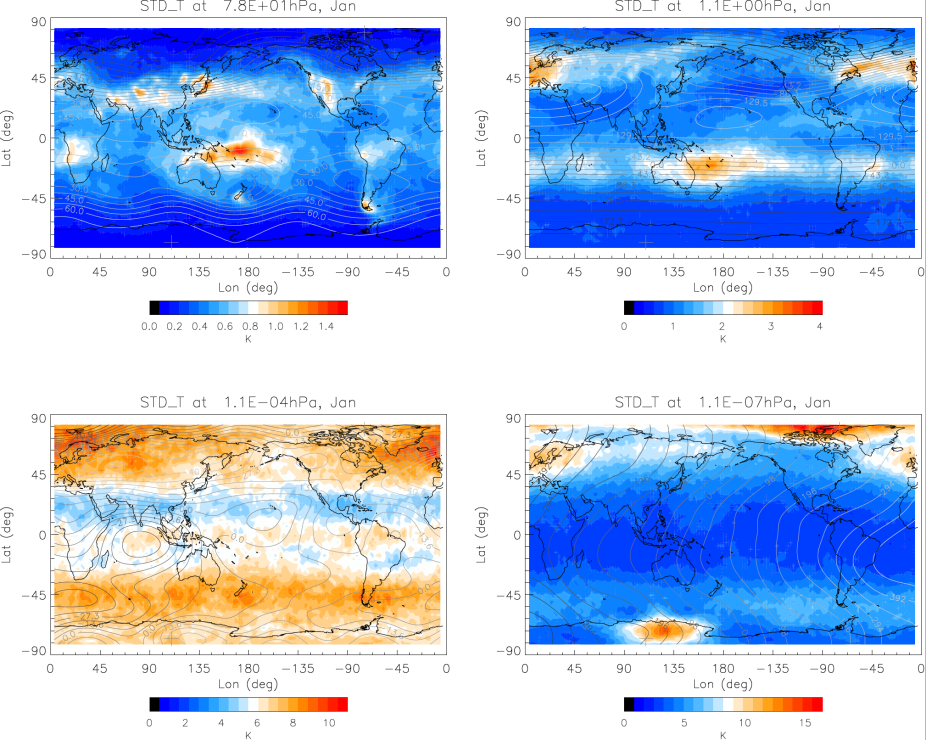
Standard deviation of temperature perturbations at (upper left) 78, (upper right) 1.1, (lower left) 1.1x10^-4 hPa and (lower right) 1.1x10^-7 hPa, averaged over four UT times (0, 6, 12, and 18 hours) for January. The contour lines are stream functions calculated from the horizontal winds. Contour lines with lighter shades have larger values. Atmosphere flow is tangent to the streamlines and toward the right of the down-gradient direction of the stream functions.
Small scale waves can be excited from daily weather near the Earth surface. These waves, termed gravity waves, can propagate upward and are thought to influence the middle and upper atmospheric regions. Such effects, however, are difficult to directly quantify by observations and numerical modeling due to their small scales and global presence. To address this challenge, we have developed a high-resolution whole atmosphere model (WACCM-X), which extends from the Earth surface to the upper thermsophere, that can partially resolve the small scale waves. The simulated waves are compared with available observations to verify the model results and to examine how these waves are distributed geographically and over altitudes. The forcing of these waves is found to be strong in the thermosphere. It affects the general circulation and the distribution of important atmospheric composition. The simulations also show that wave signatures can be clearly identified in the neutral and the ionized atmosphere, which can have important implications for space weather.