JGR- Space Physics: T. A. Siddiqui, Y. Yamazaki, C. Stolle, A. Maute, J. Lastovicka , I. K. Edemskiy, Z. Mosna.
Sudden Stratospheric Warming events are a polar winter phenomena which mainly occurs in the northern hemisphere. They are associated with large scale changes in the stratosphere which modify significant the solar and lunar tide with a 12 hr period, coupling into the upper atmosphere. One of the observed changes is in middle and low latitudes total electron content (TEC). In this study the variations of the TEC over Europe is investigated during two northern hemisphere SSWs events in 2009 and 2019. TEC variations can be caused by the vertical coupling to lower atmosphere and by geomagnetic forcing. Delineating the two cause of TEC variability in observations is challenging. We investigated the dominant drivers and their respective contributions to TEC changes during both SSW events. We simulate the SSWs using the Whole Atmosphere Community Climate Model eXtended version (WACCM-X) and compare the SSW effect on the semidiurnal solar and lunar tidal variabilities in the mesosphere-lower thermosphere (MLT) region. Further, in order to assess the mechanisms responsible for the TEC variability during the SSWs, we analyze the difference between simulations with the Thermosphere-Ionosphere Electrodynamics General Circulation Model (TIE-GCM) driven by WACCM_X fields at the lower boundary with and without geomagnetic forcing. The TIE-GCM simulations allow us to isolate the geomagnetic and lower atmospheric forcing effects on the TEC. We find that there was a major enhancement in daytime TEC over Europe during the 2019 SSW event, which was predominantly geomagnetically forced (∼80%), while for the 2009 SSW, the major variability in TEC was accounted for by lower atmospheric forcing.
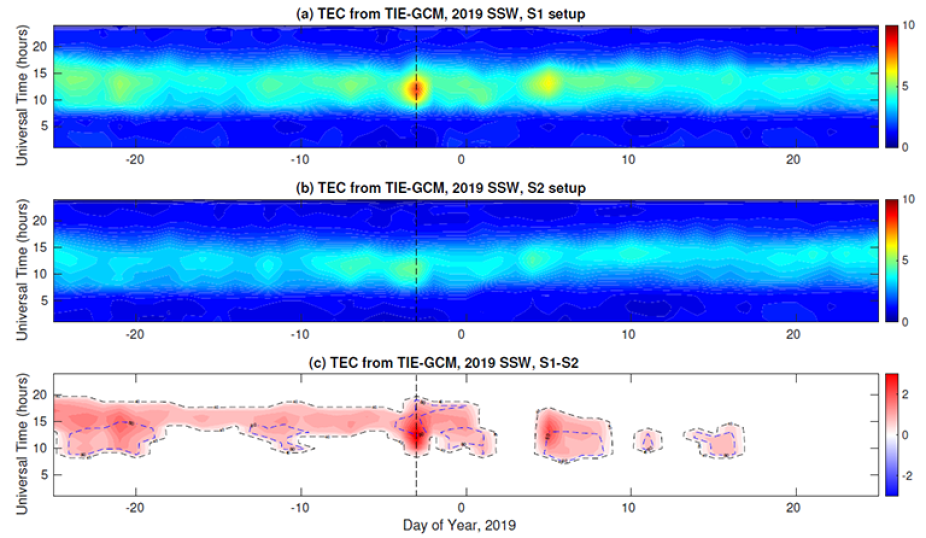
Daily averaged TEC over Europe for TIE-GCM forced at the lower boundary by WACCM-X and (a) S1 with geomagnetic forcing and (b) S2 without geomagnetic forcing, as a function of universal time for the 2019 SSW. The TEC increase attributed to the geomagnetic forcing is illustrated in (c) by the difference of (a) and (b). The filled contour lines in (c) are only plotted when absolute TEC difference exceeds 1 TECU. The dashed black and blue open contour lines mark the contribution of geo- magnetic forcing to the TEC variability at 40 and 80% levels, respectively. The vertical black dashed lines mark the day of PVW.