McA Science
The unique power of the McIntosh archive is its capability for simultaneously representing closed and open magnetic structures over a long time period (Figures 1 & 2). Closed-field regions include sunspots, plage, and, if magnetic shear/twist is concentrated at the polarity inversion line (PIL), filaments. Of particular note on a global scale are polar crown filaments, which at times extend nearly 360 degrees around the sun at high latitudes. Open-field regions manifest as unipolar coronal holes, which, depending on solar-cycle phase, may appear predominantly at the poles or as isolated structures at lower latitudes.
Figure 1: A sequence of equatorial slices from the maps (-20° to +20° latitude) is stacked along a curving axis advancing in time from top to bottom through CROTs 1910 – 2084 (including all of SC 23); width is longitude. Colors are as in Fig. 2 (bottom). In general there is a long-lived pattern where coronal holes (red/blue) appear, disappear, and reappear in a preferred (differentially-rotating) set of longitudes. The persistence of low-latitude coronal holes coupled with solar rotation drives periodic behavior, both in the solar wind and in the Earth's space environment and upper atmosphere.
The completion of the full McA digitization will provide the community with a comprehensive resource for addressing key questions including: How do active longitudes vary within and between solar cycles, for both closed and open magnetic features? Where are closed and open magnetic features rooted (as evidenced by rotation rate), and how does this depend on solar cycle phase, feature lifetime, and latitude? How does the evolution of open and closed magnetic features relate to surface flows on solar-cycle time scales? Answering any or all of these questions has important implications for our understanding of the solar dynamo, and for our interpretation of periodic variations of Earth's space environment and upper atmosphere.
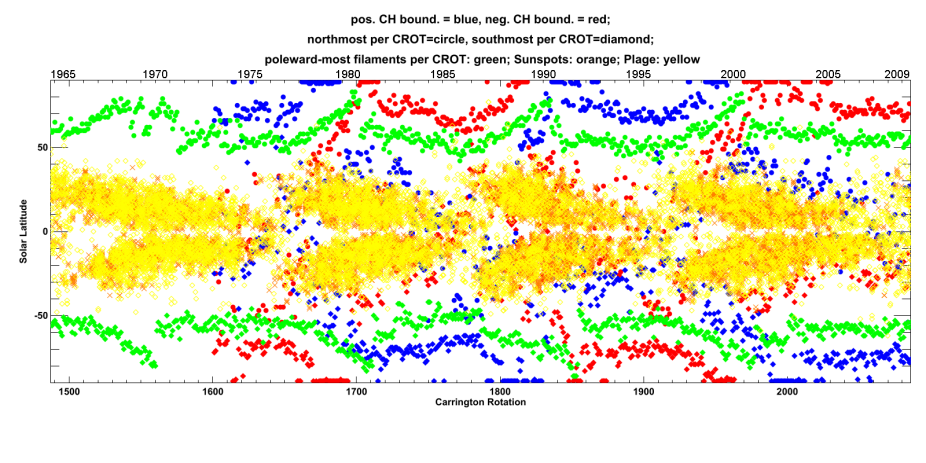
Figure 2: This figure combines the sunspot, filament and CH locations for the entire McA data set. The plot illustrates how the positive and negative-polarity open magnetic fields surround the closed-field filaments and sunspots globally. It demonstrates well how the dual cells of opposite-polarity in the higher latitudes of each hemisphere track each other through each SC, and how consistent the offset is between the higher-latitude open and closed regions and the lower latitude closed regions (sunspots and plage). These large-scale rearrangements of the open flux in unipolar areas and the formation of the polar CHs in SC 23 and 24 have recently been studied by Golbeva and Mordvinov (2017). These large-scale motions are somehow tied to the internal fluid dynamics of the Sun, and must be accounted for in dynamo models.