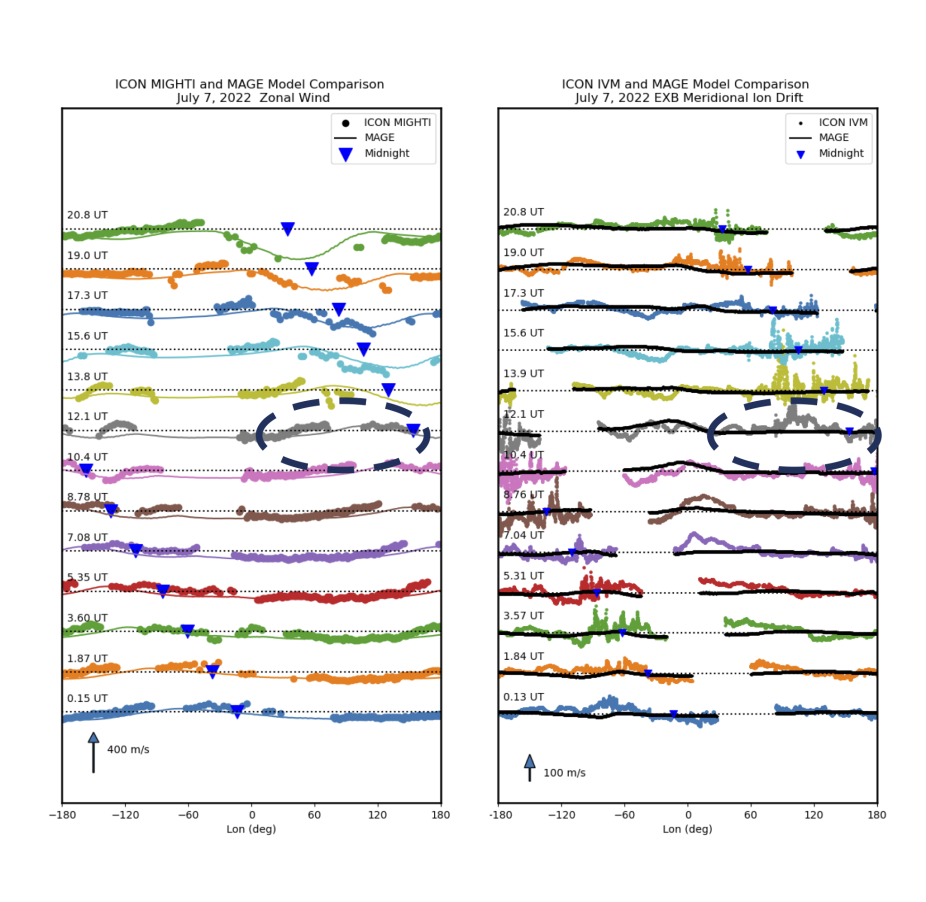
7 July, MAGE simulation and ICON observation of zonal thermospheric winds and ion drifts. ICON MIGHTI observed zonal wind and MAGE simulations along the MIGHTI sampling points (right) are plotted. Data from each orbit are plotted according to the longitude. The starting time for each orbit is provided. The midnight is marked by blue triangles. MIGHTI data gaps are due to SAA (South Atlantic Anomaly) or day-night transitions (see Englert et al., 2023). The IMF Bz southward turning occurred after 12 UT, which is highlighted by a dashed oval. The nightside zonal wind start to see reaction in the next orbit. Not much change is seen on the dayside. The ExB meridional ion drifts (vertical upward at the magnetic equator) for each orbit are plotted on the right.
JGR Space Physics: Using a numerical model where the coupled physical processes of the magnetosphere, ionosphere, and thermosphere are represented, we simulated the nighttime ionospheric disturbances caused by electric fields that enter this system from the magnetosphere and electric fields generated internally by changes in the thermospheric winds. The former is quick to reach the low latitudes, and the latter is delayed by the slower response of the neutral winds. The coupled model and NASA satellite observation showed good agreement. The results show good capability and lend themselves to the future effort to forecasting space weather at low latitudes.