Research Highlights
Research Highlights
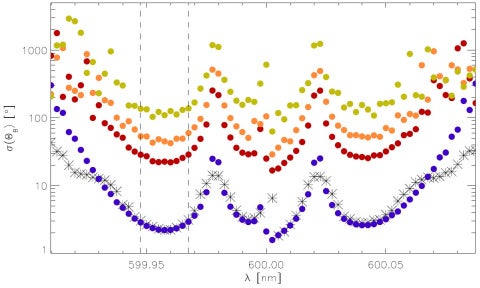
Error Propagation from Integral Moments and Spectral Derivatives of Stokes Profiles to Magnetic Observables
Aims: To derive convenient analytic estimations of magnetic inference errors, which can be used to inform and facilitate the creation of the science-traceability matrix of a polarimetric instrument.
Methods: We study the general problem of the propagation of Poissonian noise in polarized light signals to derived data products of the Stokes profiles, namely integral moments of arbitrary orders and spectral derivatives of the intensity. In particular, we derive the errors on the longitudinal and transversal projections of the magnetic field inferred from the weak-field approximation (WFA) of the Zeeman effect.
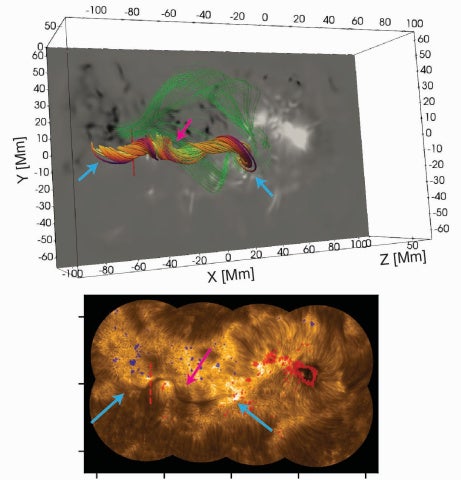
Chromospheric Magnetic Field Extrapolations Reveal the Flux-rope Configuration of a Solar Filament
Solar eruptions are powered by magnetic energy stored in the Sun’s atmosphere, but the magnetic structure that exists before an eruption is difficult to determine. In particular, scientists debate whether solar filaments are supported by pre-existing, twisted magnetic flux ropes or by less twisted magnetic arcades that form flux ropes only during eruption. We developed a physics-informed method that reconstructs the three-dimensional magnetic field using measurements from both the Sun’s visible surface and the chromosphere above it.
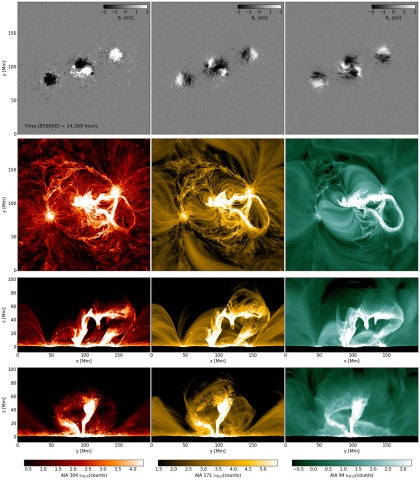
Data-inspired simulation of AR 11158
We present a data-inspired simulation of NOAA active region AR 11158. We simulate the formation of a collisional polarity inversion line (cPIL) by moving sunspots in a quadrupolar configuration along the centroid positions extracted from AR 11158. This process builds up free energy in the corona exceeding 4 × 10³² erg, out of which about 2 × 10³² erg are released in an X-flare followed by a series of smaller flares in the B to M range.
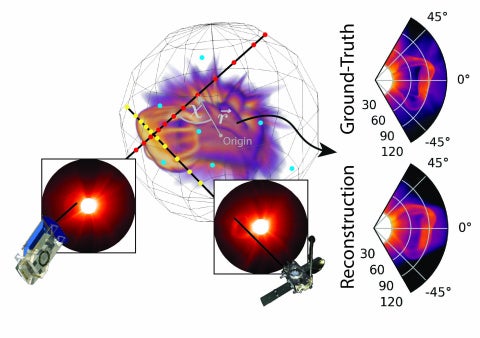
SuNeRF-CME: Physics-Informed Neural Radiance Fields for Tomographic Reconstruction of Coronal Mass Ejections
Coronal mass ejections (CMEs) are large eruptions of plasma from the Sun that can affect space weather near Earth. Coronagraphs observe these eruptions by measuring sunlight scattered by electrons in the solar corona and heliosphere. However, these images are two-dimensional projections of a three-dimensional structure, which makes it difficult to determine the true shape, density, and motion of a CME. We introduce SuNeRF-CME, a new method for reconstructing the three-dimensional plasma structure of CMEs from coronagraph images taken from multiple viewpoints.
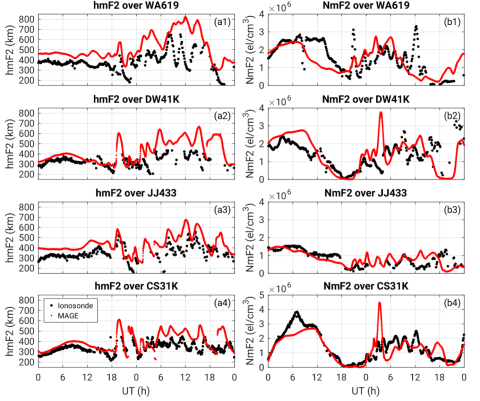
Large-Scale Traveling Ionospheric Disturbances over the Asian-Pacific Sector During 10-11 May 2024 Geomagnetic Superstorm: Ionosonde Observation and MAGE Simulation
The large-scale traveling ionospheric disturbances (LSTIDs) over the Asian-Pacific sector during the 10-11 May 2024 superstorm are investigated using ionosonde observation and simulation from a whole geospace model - Multiscale Atmosphere Geospace Environment (MAGE), which fully couples multiple magnetosphere, ionosphere and thermosphere models.
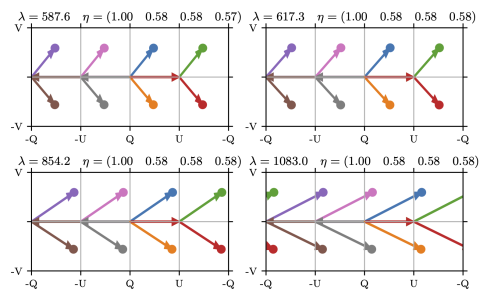
Considerations for Calibration of Stokes Polarimeters
Solar physicists use instruments called polarimeters to measure the polarization of sunlight, which reveals the strength and structure of the Sun's magnetic field. Before a polarimeter can deliver reliable measurements, it must be calibrated by feeding known polarization states into the instrument. Calibration takes time, and telescope time is precious — particularly for solar telescopes, where intense sunlight limits how long calibration optics can safely remain in the beam. This raises a key question: what sequence of calibration measurements yields the most accurate result in a given amount of time?
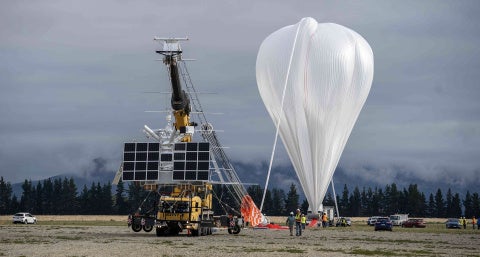
HIWIND observation of daytime thermospheric winds over New Zealand and comparison with model simulation
A balloon-borne instrument called HIWIND was launched from New Zealand to observe thermospheric winds in the mid-latitudes. The observed winds were compared with TIEGCM model simulation and were found to be much larger than the simulated results.
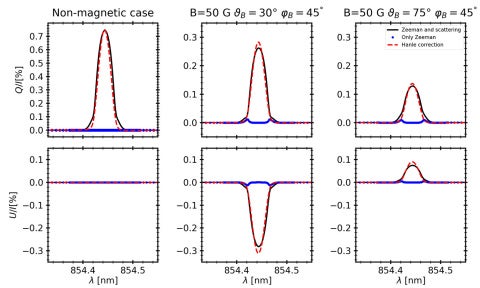
Slab model of the Hanle effect for magnetic sensitive chromospheric lines
We address the need to model the effects of radiation anisotropy and atomic coherence on the Stokes profiles
of magnetically-sensitive lines formed in the solar chromosphere. Accounting for the physics of scattering polarization associated with these effects, and how they map to the strength and direction of weak magnetic fields on the Sun is a formidable computational task when done fully self-consistently. This has hindered the broad heliophysics community from gaining prompt access to reliable data products from solar facility spectro-polarimeters concerning quiet-Sun magnetism.
Optimal Polarization Modulation and Calibration Schemes
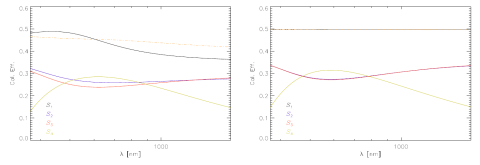
Authors R. Casini, D. Harrington, and A. de Wijn review the algebraic definition of the efficiency of a polarization modulation scheme, which is commonly adopted for solar and stellar spectro-polarimetry applications, and generalize it to allow distinct states of the modulation cycle to have arbitrary throughput and different photon-noise statistics for each state.