Research Highlights
Research Highlights
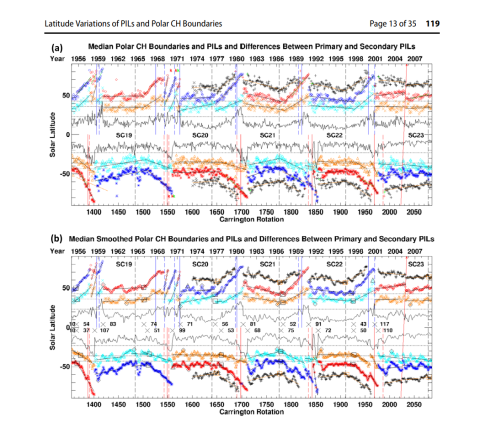
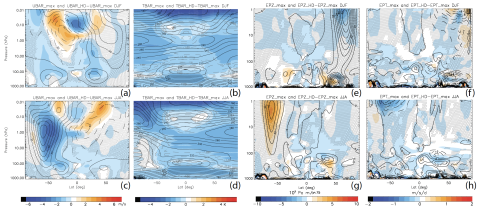
Latitude Variations in Primary and Secondary Polar Crown Polarity Inversion Lines and Polar Coronal Hole Boundaries over Five Solar Cycles
B. A. Emery, D. F. Webb, S. E. Gibson, I. M. Hewins, R. H. McFadden, and T. A. Kuchar undertake a five solar-cycle (SC 19 - 23) ≈55-year (December 1954 to August 2009) study of the high latitude polarity inversion lines (PILs) using the recently digitized McIntosh Archive (McA) of solar synoptic (Carrington) maps. They observe hemispheric differences in the "Rush to the Poles" (RttP.)
Temperature of a long-lived solar coronal cavity
Urszula Bąk-Stęślicka, Sarah E. Gibson, Marek Stęślicki analysed a long-lived coronal cavity observed from 17 March 2012 to 21 March 2012 applying a differential emission measure method to obtain both a temperature distribution and the average temperature over all five observational days.
Understanding nighttime ionospheric depletions associated with sudden stratospheric warmings in the American sector
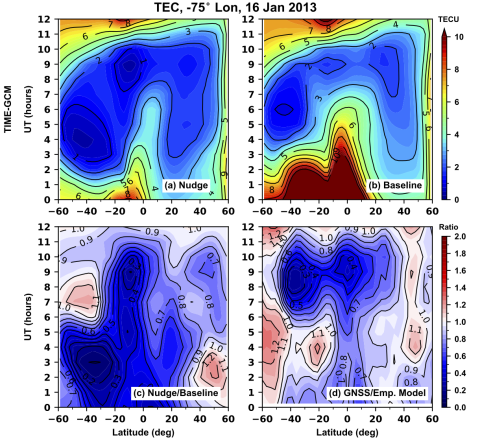
N. M. Pedatella et. al. focus on understanding what drives the previously observed deep nighttime ionospheric hole in the American sector during the January 2013 sudden stratospheric warming (SSW). Performing a set of numerical experiments with TIME-GCM they demonstrate that this nighttime ionospheric hole was the result of increased poleward and down magnetic field line plasma motion at low and midlatitudes in response to altered F-region neutral meridional winds.
Thermospheric and Ionospheric Effects by Gravity Waves from the Lower Atmosphere
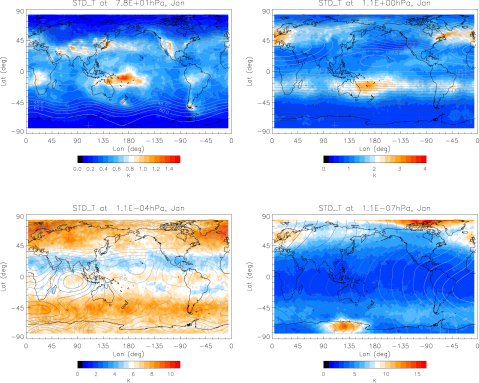
Han-Li Liu, Peter H. Lauritzen, Francis Vitt, and Steve Goldhaber have developed a high-resolution whole atmosphere model (WACCM-X), which extends from the Earth surface to the upper thermsophere, that can partially resolve the small scale waves (gravity waves.) The simulated waves are compared with available observations to verify the model results and to examine how these waves are distributed geographically and over altitudes.

Derivation of Instrument Requirements for Polarimetry using Mg, Fe, and Mn lines between 250 and 290 nm
A.G. de Wijn, P.G. Judge, R. Ezzeddine, A. Sainz Dalda recently argued that a region of the solar spectrum in the near-UV between about 250 and 290 nm is optimal for studying magnetism in the solar chromosphere due to an abundance of Mg II, Fe II, and Fe I lines that sample various heights in the solar atmosphere.
Climate responses under an extreme quiet sun scenario
Han-Li Liu, Matthias Rempel, Gokhan Danabasoglu, Stanley C. Solomon, and Joseph M. McInerney tackle the problem of clearly identifying solar signal from the very large climate variability on broad time scales. Providing a lower bound of the solar minimum condition according to current understanding of solar physics and specifying the extremely low solar minimum condition in a climate model that considers the effects of ocean and middle atmosphere, they identify significant climate responses.
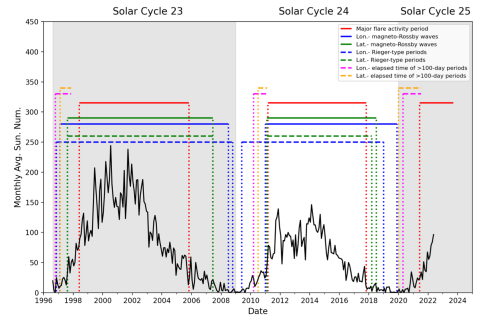
On the connection between Rieger-type and magneto-Rossby waves driving the frequency of the large solar eruptions during Solar Cycles 19 - 25
Mausumi Dikpati, et. al. present findings of a unique evolution of identified shorter periodicities in global solar activity variation, like the Rieger-type, arising from magnetic Rossby waves, throughout the Solar Cycles 19-25. They report is further observational evidence of the strong relationship between the Rieger-type periodicity, magneto-Rossby waves, and major solar flare activity.
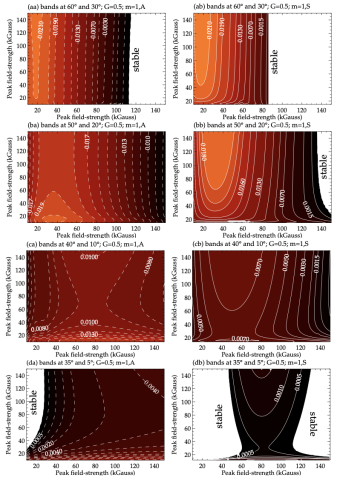
Magnetohydrodynamics Instabilities of Double Magnetic Bands in a Shallow-water Tachocline Model: I Cross-equatorial Interactions of Bands
Bernadett Belucz, Mausumi Dikpati, Scott W. McIntosh, Robert J. Leamon, and Robertus Erdelyi discuss the Extended Solar Cycle (ESC) activity and strong overlapping between cycles. They compute the unstable eigenmodes for MHD Rossby waves at the base of the convection zone and study how the properties of these energetically active Rossby waves change as these band-pairs migrate equatorward.
Cultivating a culture of inclusivity in Heliophysics
Dr. Astrid Maute talked to a large number of heliophysicists while attending the CEDAR 2022 workshop. In this paper she describes a concerning number of heliophysicists that shared terrifying stories and experiences of bullying, harassment, burnout, etc., from across career levels, institution types, and job titles. While writing these position papers, the number of people who privately shared terrifying stories and experiences of bullying and harassment was insane.